Introduction
BabySOARus runs sandboxed code over Splunk events. You write a few lines of Python in the search bar, or drop in a compiled WebAssembly component, and it runs against every event flowing through the pipeline.
index=proxy
| exec inline="for e in events: e['host_upper'] = e['dest_host'].upper()"

That much you could do with eval. The point of BabySOARus is everything eval
cannot do: loops, dictionaries, entropy calculations, statistics, JSON
parsing, outbound HTTP calls, and the parts of the Python standard library you
already know, all inside a sandbox that cannot touch the host.
Why It Exists
Splunk's own extension points make you choose between two bad options.
SPL is fast and safe, but it is not a programming language. Expressing
"work out the standard deviation of the gaps between these timestamps, and
score how regular they look" in eval is possible and nobody enjoys reading
the result.
Custom search commands give you a real language, but Splunk starts a fresh operating system process for every search. The interpreter boots, imports its libraries and shuts down again, for every single search, and you pay that before your code does any work. Teams end up avoiding them.
BabySOARus keeps the real language and removes the startup cost. A background daemon holds one WebAssembly engine and a pool of interpreters that are already warmed up. A search connects to it over a Unix socket and starts streaming events immediately.
| What happens | Process-per-search | BabySOARus |
|---|---|---|
| Engine construction | every search | once per host |
| Interpreter startup | every search | once per pooled instance |
| Compiling your snippet | every batch | once per search |
| Overhead of a warm search | seconds | microseconds |
| Time to first result | after a 50,000-event buffer | after 32 events |
The performance chapter explains where the time goes and how to measure it on your own hardware.
What You Get
A real language in the search bar. Loops, comprehensions, try/except,
json, re, hashlib, statistics, ipaddress, datetime, and the rest
of the standard library.
Outbound HTTP. Enrich against threat intelligence, look up an asset owner, call the Splunk REST API, post to a case management system. From the search bar, without an add-on.
Compiled functions when you need speed. Ship a .wasm component built
from Rust, Go, or any language that targets the component model. Drop it in a
directory and it is callable before your next search, with no restart.
A sandbox you can reason about. Guest code gets no sockets, no filesystem beyond the lookup directories you expose, no environment variables and a hard execution deadline. It is a WebAssembly component, not a subprocess.
The same code in three places. A search, a scheduled alert action, and a generating command all run the identical guest. What you prototype interactively is what runs on a schedule.
Where It Fits
Detection engineers use it to express logic that SPL makes awkward: entropy, beaconing intervals, sequence analysis, decoding nested payloads.

Threat hunters use it to iterate. Change five characters, press enter, see the result. No app to package, no restart, no deployment.
Incident responders use it as the glue that would otherwise require a SOAR platform: enrich, decide, call an API, all triggered by a scheduled search. See Replacing SOAR workflows.
And increasingly, AI agents use it as their execution surface, because "generate a short Python snippet and run it over these events" is a far more reliable thing to ask a model for than "generate correct SPL". See AI agents.
Getting Started
- Installation takes about five minutes.
- Your first search is a one-liner.
- A tour in five searches covers most of what you will ever need.
If you would rather read code, the app ships thirty-one library entries -- detections, hunts, enrichment, response actions, lookup builders -- and every one is readable source in the editor: open the file tree and the built-ins are all there.
Why "BabySOARus"?
Because every good name was taken, and this one is at least honest.
sp is Splunk. wasm is WebAssembly. Put them together and you get
BabySOARus, which nobody can pronounce and everybody can spell wrong.
We have heard, and gently declined:
- sp-wazz-um. Sounds like a fizzy drink.
- spawzm. Sounds like something you should see a doctor about.
- spuh-WASM. Correct, apparently, and impossible to say twice in a row.
- BabySOARus, in capitals, like an initialism. It is not one. Please stop.
The internal pronunciation guide, in full:
Say "Splunk". Say "WebAssembly". Do not say either of them again.
The Names We Did Not Use
splunk-wasm. Splunk have lawyers, and the lawyers have opinions about product names beginning with "Splunk".
wasmlunk. Sounds like a Dutch sandwich.
Pipeline Execution Runtime for Sandboxed Analytics. We got as far as noticing the acronym before anyone typed it into a slide deck.
exec. The command is still called exec, because that is what it does and
because renaming it would have broken every search anyone had already written.
But naming the project exec would have produced bug reports like "exec is
broken" and support threads like "have you tried exec?" that could mean
absolutely anything.
wasi-splunk-runtime. Accurate. Also seven syllables. In an incident, at three in the morning, nobody is typing seven syllables.
Does It Matter?
Not really. What matters is that when a detection engineer says "just wasm
it", everyone in the room knows they mean "write four lines of Python instead
of forty lines of eval", and they get on with it.
That is the whole naming philosophy: short enough to become a verb, odd enough to be searchable, and vague enough that we can add features without the name becoming a lie.
If you must have a pronunciation, we suggest "BabySOARus", said quickly and with confidence. It works for us.
Installation
- Requirements
- Get the Package
- Install the Package
- Upgrading
- Check It Works
- Distributed Deployments
- Uninstalling
- Setting up a Local Test Instance
BabySOARus ships as a normal Splunk app, babysoarus.spl. Install it the way you would install
any other Splunk app: no Rust, no Python, no build step. Those only matter if you are
building BabySOARus from source (below), which is not what a customer does.
Requirements
| Splunk | 9.0 or later, tested on 10.4 |
| Platform | Linux x86-64 |
Nothing Python-related runs on the Splunk host at search time. The Python interpreter
exec.wasm/exec.cwasm bundles is a WebAssembly component built once, at release time,
not on your Splunk instance.
Get the Package
BabySOARus ships as a single .spl file. Two places to get it, both the
same bytes:
- Splunkbase -- search for BabySOARus. The usual route, and the one your platform team will expect.
- babysoarus.hisn.io/download/babysoarus.spl -- a direct download, for an air-gapped build host or anywhere Splunkbase is not reachable.
There is nothing to sign up for and no licence key to request first: every install runs the full product for 90 days from the moment it starts. See Licensing.
Install the Package
Splunk Web: Apps > Manage Apps > Install app from file, choose babysoarus.spl, then
restart Splunk when prompted.
Or from the command line:
$SPLUNK_HOME/bin/splunk install app /path/to/babysoarus.spl
$SPLUNK_HOME/bin/splunk restart
Upgrading
Stop the daemon before installing a new package version, not after: babysoarus-daemon keeps
its own binary open while it runs, and an in-place install over a running binary fails with
Text file busy (found live, not assumed, testing this exact page's own instructions).
Use bin/stop-daemon.sh, not a bare pkill: the daemon drains searches already in progress
before it actually exits (up to five minutes by default, BABYSOARUS_SHUTDOWN_GRACE_SECS to
change that), so a search that happens to be running when you upgrade finishes normally
instead of failing -- but that also means the daemon may take real time to stop, and copying
a new binary in before it actually has is the same Text file busy failure by a different
path. The script sends the stop signal and then genuinely waits for the process to be gone.
$SPLUNK_HOME/etc/apps/babysoarus/bin/stop-daemon.sh \
  "$SPLUNK_HOME/etc/apps/babysoarus/bin/babysoarus-daemon"
$SPLUNK_HOME/bin/splunk install app /path/to/babysoarus.spl -update 1
$SPLUNK_HOME/bin/splunk restart
Once the new binary is in place, the next search that reaches exec/execgen/execalert
starts a fresh daemon running it automatically -- the same ordinary lazy-start that runs on a
completely fresh install, nothing extra to trigger by hand.
Check It Works
| makeresults | exec inline="for e in events: e['ok'] = 'BabySOARus is running'"
The first search after a restart takes a moment longer while the daemon starts. Every search after that is warm.
Distributed Deployments
The daemon is per host. Deploy the app to every search head and indexer that will run the command, exactly as you would any app containing a custom search command. Each host starts its own daemon on first use.
That has consequences for where your code runs and for state that accumulates during a search. Operations covers them.
Uninstalling
$SPLUNK_HOME/etc/apps/babysoarus/bin/stop-daemon.sh \
  "$SPLUNK_HOME/etc/apps/babysoarus/bin/babysoarus-daemon"
$SPLUNK_HOME/bin/splunk remove app BabySOARus
$SPLUNK_HOME/bin/splunk restart
Stopping it the same graceful way as an upgrade, rather than a bare pkill, is not required
here the way it is for an in-place binary replacement -- removing the app directory does not
conflict with a still-running process the way overwriting its binary does -- but it means a
search already in progress still finishes normally instead of failing partway through.
The daemon holds no state outside the app directory, so removing it is complete.
dist/babysoarus/
  bin/            babysoarus-cmd, babysoarus-alert, babysoarus-daemon
  wasm/           exec.wasm, exec.cwasm    the bundled Python interpreter
  functions/
    public/       your .wasm functions, hot-reloaded
    private/
  default/        commands.conf, alert_actions.conf, app.conf
  metadata/
To install straight from a local build without going through the .spl:
export SPLUNK_HOME=/opt/splunk
make install
$SPLUNK_HOME/bin/splunk restart
make install stops any daemon from a previous install, waiting for it to actually exit,
before replacing the binaries (scripts/stop-daemon.sh, the same script bin/stop-daemon.sh
ships as, above) -- so an old one cannot keep serving stale code, and so a search still in
progress finishes rather than getting cut off.
Setting up a Local Test Instance
The repository has scripts for standing up a throwaway Splunk to try things against. They need no root.
bash scripts/install-splunk.sh   # downloads and unpacks into ~/splunk
bash scripts/setup-splunk.sh     # seeds an admin account and starts it
SPLUNK_HOME=~/splunk make install
bash scripts/seed-demo-data.sh   # ~10,000 events of sample telemetry
scripts/seed-demo-data.sh creates an index called babysoarus_demo containing proxy,
authentication and DNS logs with a few deliberate anomalies buried in them. Every example
in these docs runs against it.
Your First Search
Run this:
| makeresults count=3
| streamstats count as n
| exec inline="for e in events:
    e['squared'] = int(e['n']) ** 2
    e['greeting'] = f'hello from WebAssembly, event {e[\"n\"]}'"

Three events in, three events out, each with two new fields. The Python ran inside a WebAssembly sandbox, in a process that was already running before you pressed enter.
What Just Happened
events is a list of dictionaries holding the current batch of events. You
mutate it, and the pipeline carries on with whatever you leave behind.
That is the whole interface. There is no callback to register, no class to
subclass, no yield. Just a list called events.
The Three Things You Can Do
Change events by mutating them in place:
| exec inline="for e in events: e['bytes_mb'] = int(e['bytes']) / 1048576"
Remove events by rebinding events to a shorter list:
| exec inline="events = [e for e in events if int(e['status']) >= 500]"
Add events by rebinding it to a longer one:
| exec inline="events = [dict(e, tag=t) for e in events for t in e['tags'].split(',')]"
Quoting
SPL passes everything after inline= to the command as one string, so the
usual SPL quoting rules apply. Two habits avoid nearly all the pain:
Use single quotes inside Python, and double quotes for the SPL argument:
| exec inline="for e in events: e['x'] = 'value'"
Escape double quotes when you genuinely need them inside Python:
| exec inline="for e in events: e['x'] = e[\"field with spaces\"]"
Multi-line snippets work as written. Indentation is ordinary Python indentation, so keep it consistent.
If a snippet grows past about ten lines, that is a good sign it belongs in a custom function or a macro instead.
Errors
Mistakes are reported against the search, not swallowed:
| makeresults | exec inline="for e in events: e['x'] = 1 / 0"
FATAL: Error in 'exec' command: ZeroDivisionError: division by zero
A syntax error is caught before any events are processed, so a typo never half-processes a search:
FATAL: Error in 'exec' command: SyntaxError: invalid syntax (line 2)
Next
A tour in five searches covers the rest: HTTP calls, generating events, filtering, and calling compiled functions.
A Tour in Five Searches
- 1. Compute Something SPL Finds Awkward
- 2. Filter with Logic, Not a Regular Expression
- 3. Call an API from the Search Bar
- 4. Generate Events from Nothing
- 5. Call a Compiled Function
- Where to Go Next
Five searches that between them cover almost everything BabySOARus does. All of
them run against the babysoarus_demo index created by
scripts/seed-demo-data.sh.
1. Compute Something SPL Finds Awkward
Shannon entropy is a good example. It needs a character histogram, a
logarithm and a sum. In eval that is a nightmare. In Python it is four
lines.
index=babysoarus_demo sourcetype=babysoarus:proxy
| stats sum(bytes_out) as bytes_out count as requests by dest_host, user
| sort - bytes_out
| head 8
| exec inline="import math
for e in events:
    host = e['dest_host']
    counts = {}
    for ch in host:
        counts[ch] = counts.get(ch, 0) + 1
    total = len(host)
    entropy = -sum((c/total) * math.log2(c/total) for c in counts.values())
    e['entropy'] = round(entropy, 2)
    e['longest_label'] = max(len(l) for l in host.split('.'))
    e['megabytes_out'] = round(int(e['bytes_out']) / 1048576, 2)
    e['verdict'] = 'suspicious' if entropy > 3.6 and e['longest_label'] > 12 else 'ordinary'"
| table dest_host user requests megabytes_out entropy longest_label verdict
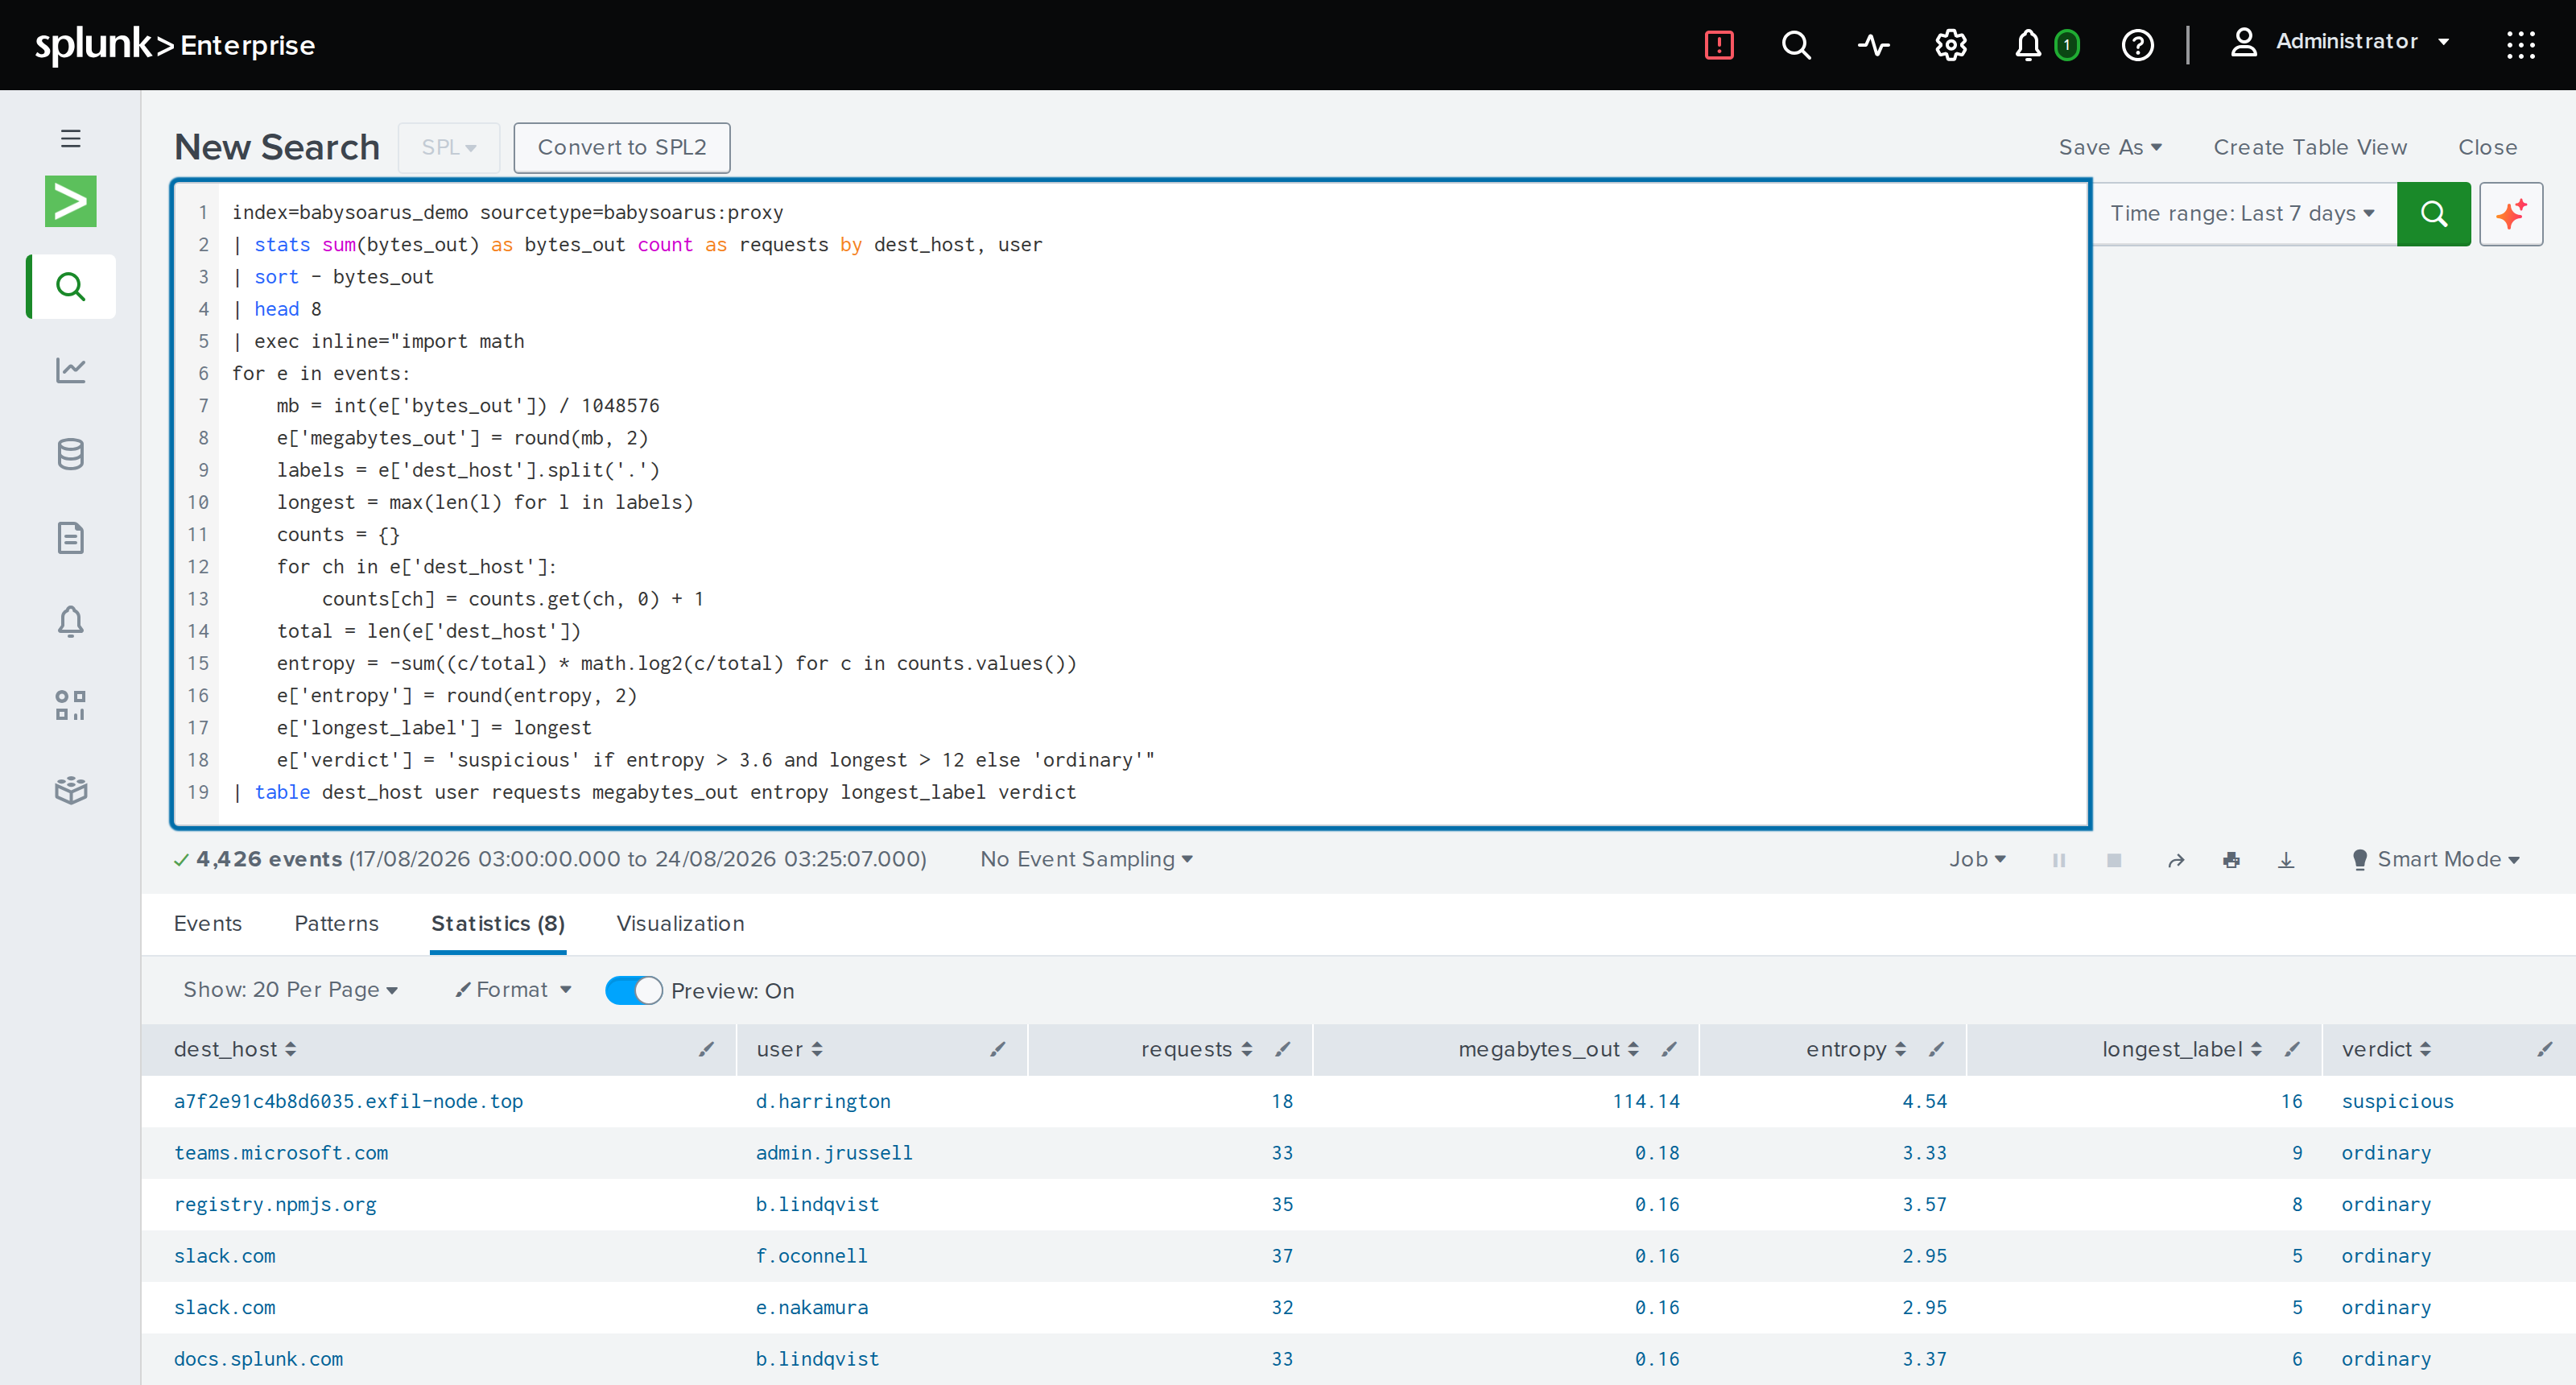
One domain scores 4.54 with a 16-character label and 114 MB outbound. The rest of the estate sits under 3.6. The verdict column is the detection.
2. Filter with Logic, Not a Regular Expression
Rebinding events removes rows. Here the decision needs two derived values
and a comparison between them, which is exactly the shape where struggles
with.
index=babysoarus_demo sourcetype=babysoarus:auth action=failure
| stats dc(user) as users_targeted count as attempts values(user) as targets by src_ip
| exec inline="for e in events:
    users = int(e['users_targeted'])
    attempts = int(e['attempts'])
    ratio = attempts / users if users else attempts
    e['attempts_per_user'] = round(ratio, 2)
    e['pattern'] = 'password spray' if users >= 8 and ratio < 6 else \
                   ('brute force' if ratio >= 6 else 'noise')
    e['severity'] = 'high' if users >= 8 else 'low'
events = [e for e in events if e['pattern'] != 'noise']"
| table src_ip pattern severity users_targeted attempts attempts_per_user
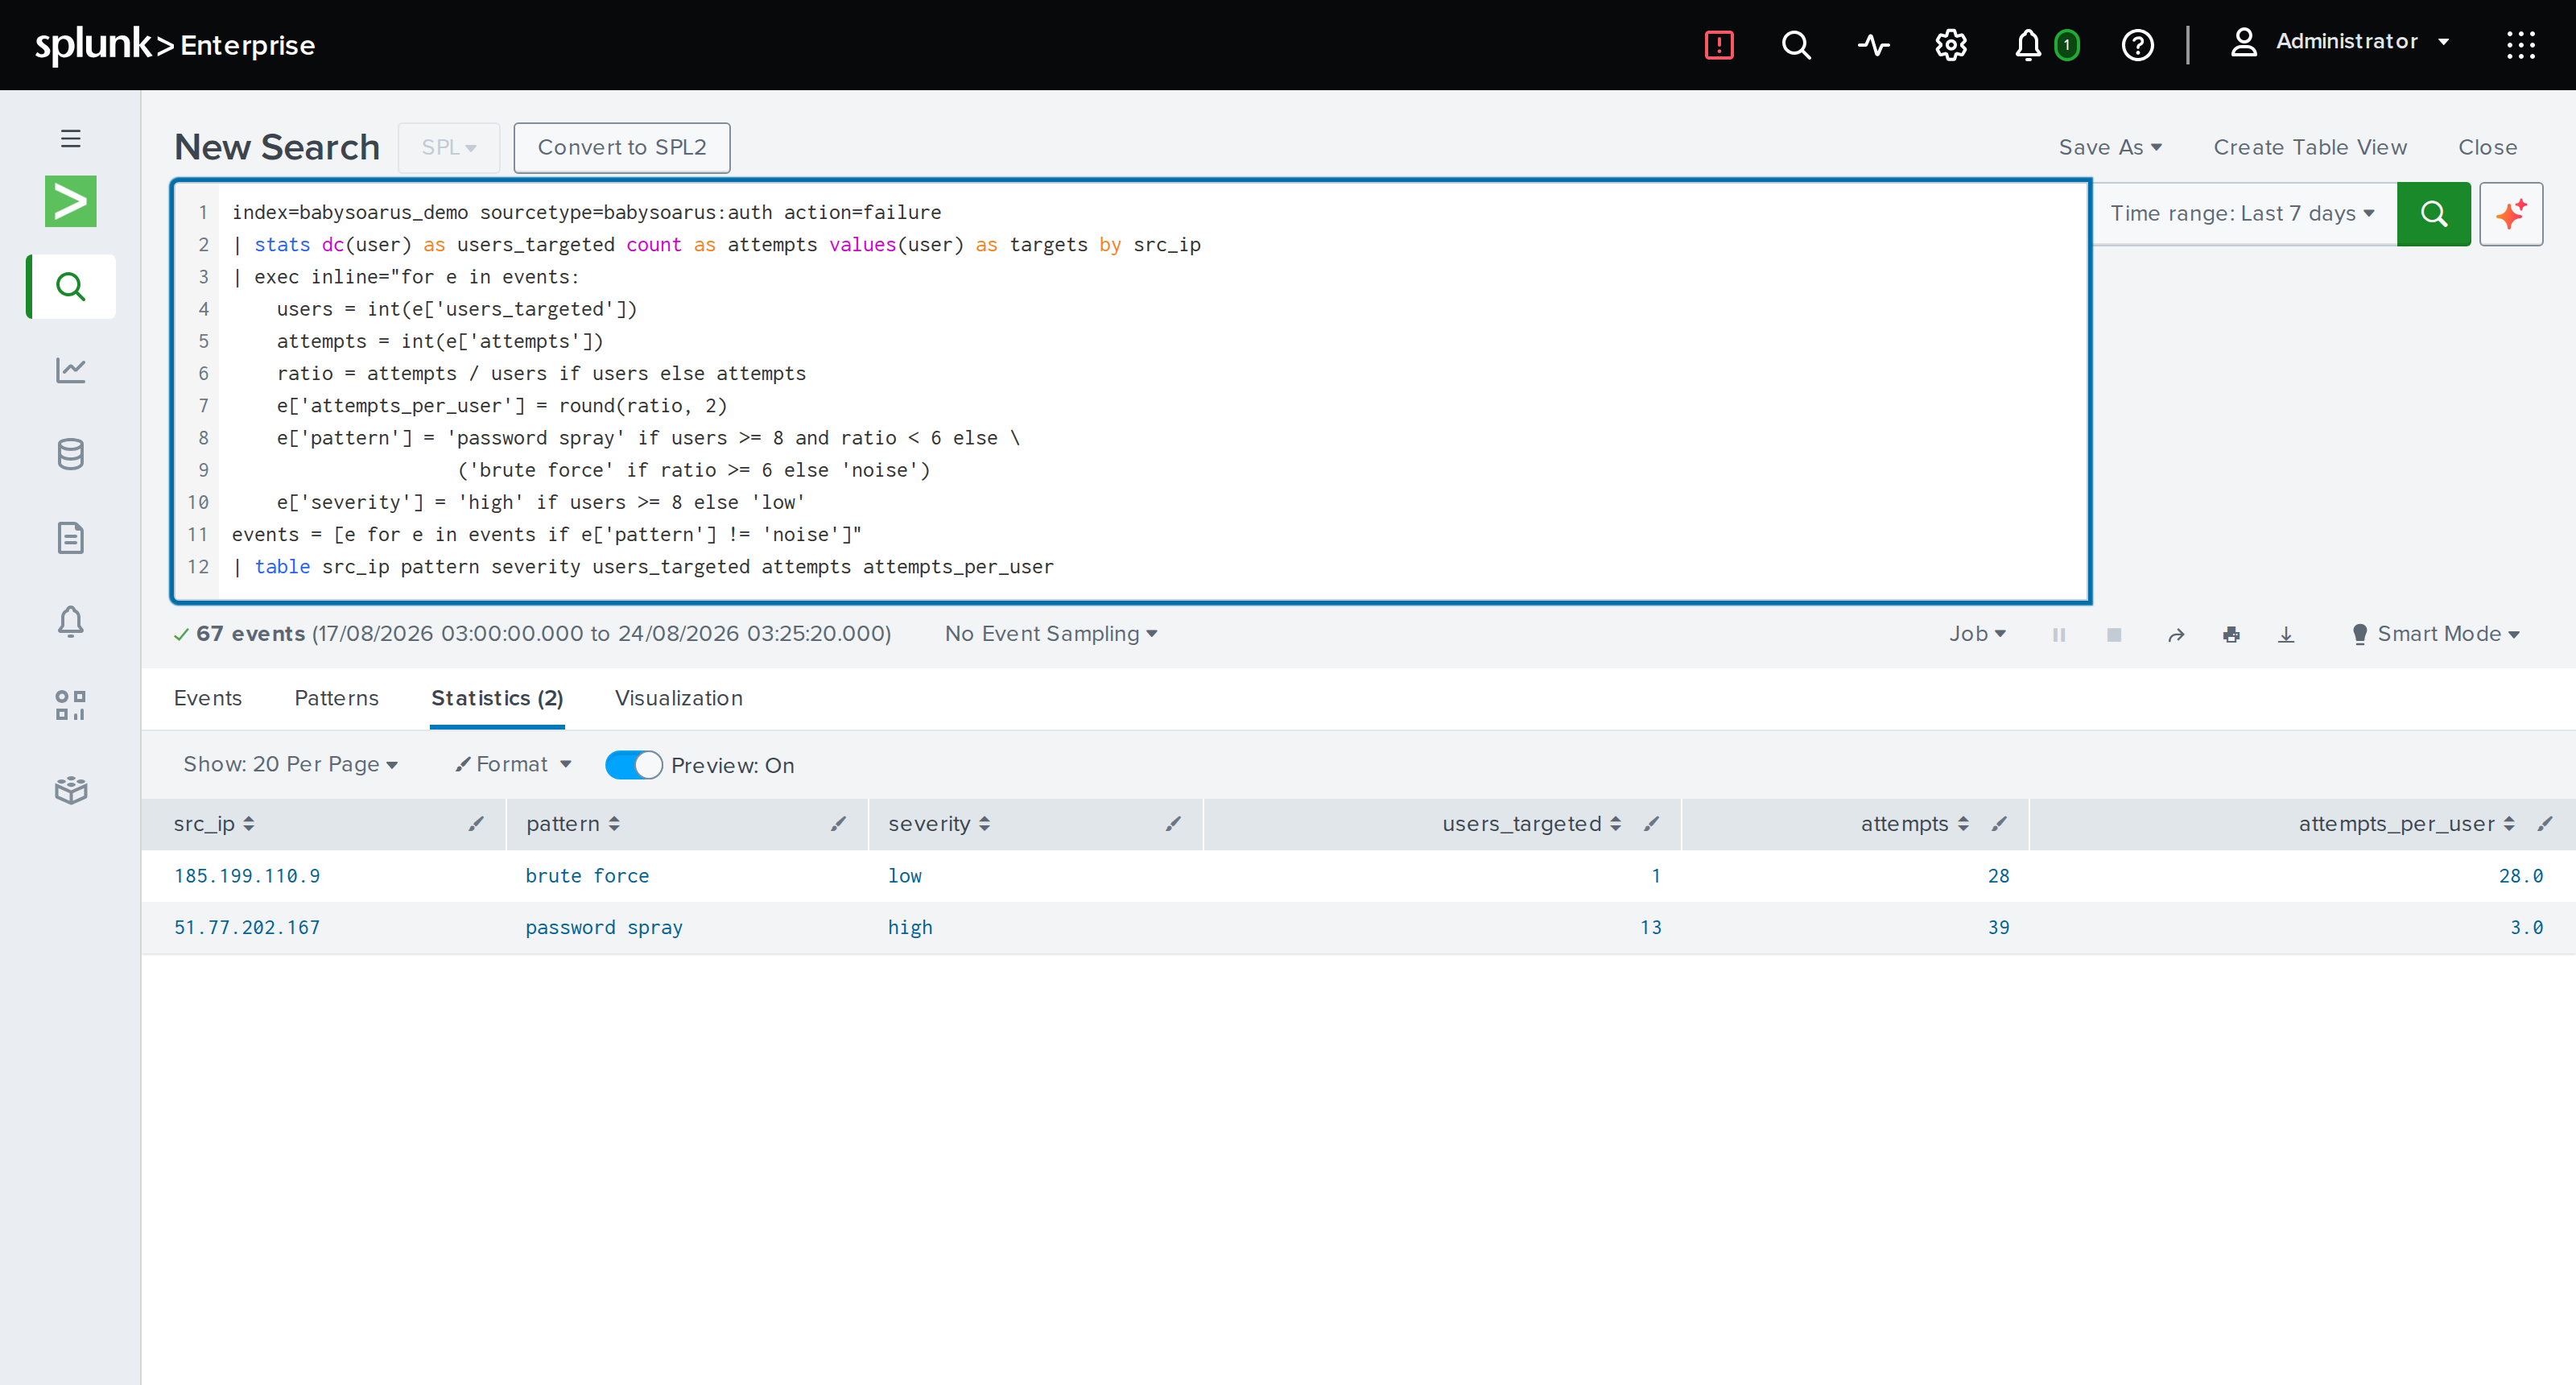
Many failures against many accounts is spraying. Many failures against one account is brute force. The difference matters to whoever gets paged, and it is one expression.
3. Call an API from the Search Bar
http_request performs an outbound call on the host's behalf. Guest code has
no sockets of its own.
| makeresults
| exec inline="r = http_request('GET', 'https://api.github.com/repos/bytecodealliance/wasmtime',
    headers={'User-Agent': 'BabySOARus'})
data = json.loads(r['body'])
for e in events:
    e['stars'] = data['stargazers_count']
    e['status'] = r['status']"
For Splunk's own REST API there is splunk_request, which reuses the current
search's credentials and URL:
| makeresults
| exec inline="r = splunk_request('GET', '/services/server/info?output_mode=json')
info = json.loads(r['body'])['entry'][0]['content']
for e in events:
    e['splunk_version'] = info['version']
    e['server_name'] = info['serverName']"
Requests are made once per micro-batch, not once per event, if you write the call outside the loop as above. That detail is the difference between one API call and five hundred.
4. Generate Events from Nothing
execgen starts a pipeline rather than transforming one. Assign to events
and whatever you build becomes the search results.
| execgen inline="import datetime
events = []
for i in range(8):
    events.append({
        'window': (datetime.datetime(2026, 7, 31, 9, 0) + datetime.timedelta(hours=i)).isoformat(),
        'shift': 'day' if i < 4 else 'evening',
        'target_events': 1000 * (i + 1),
    })"
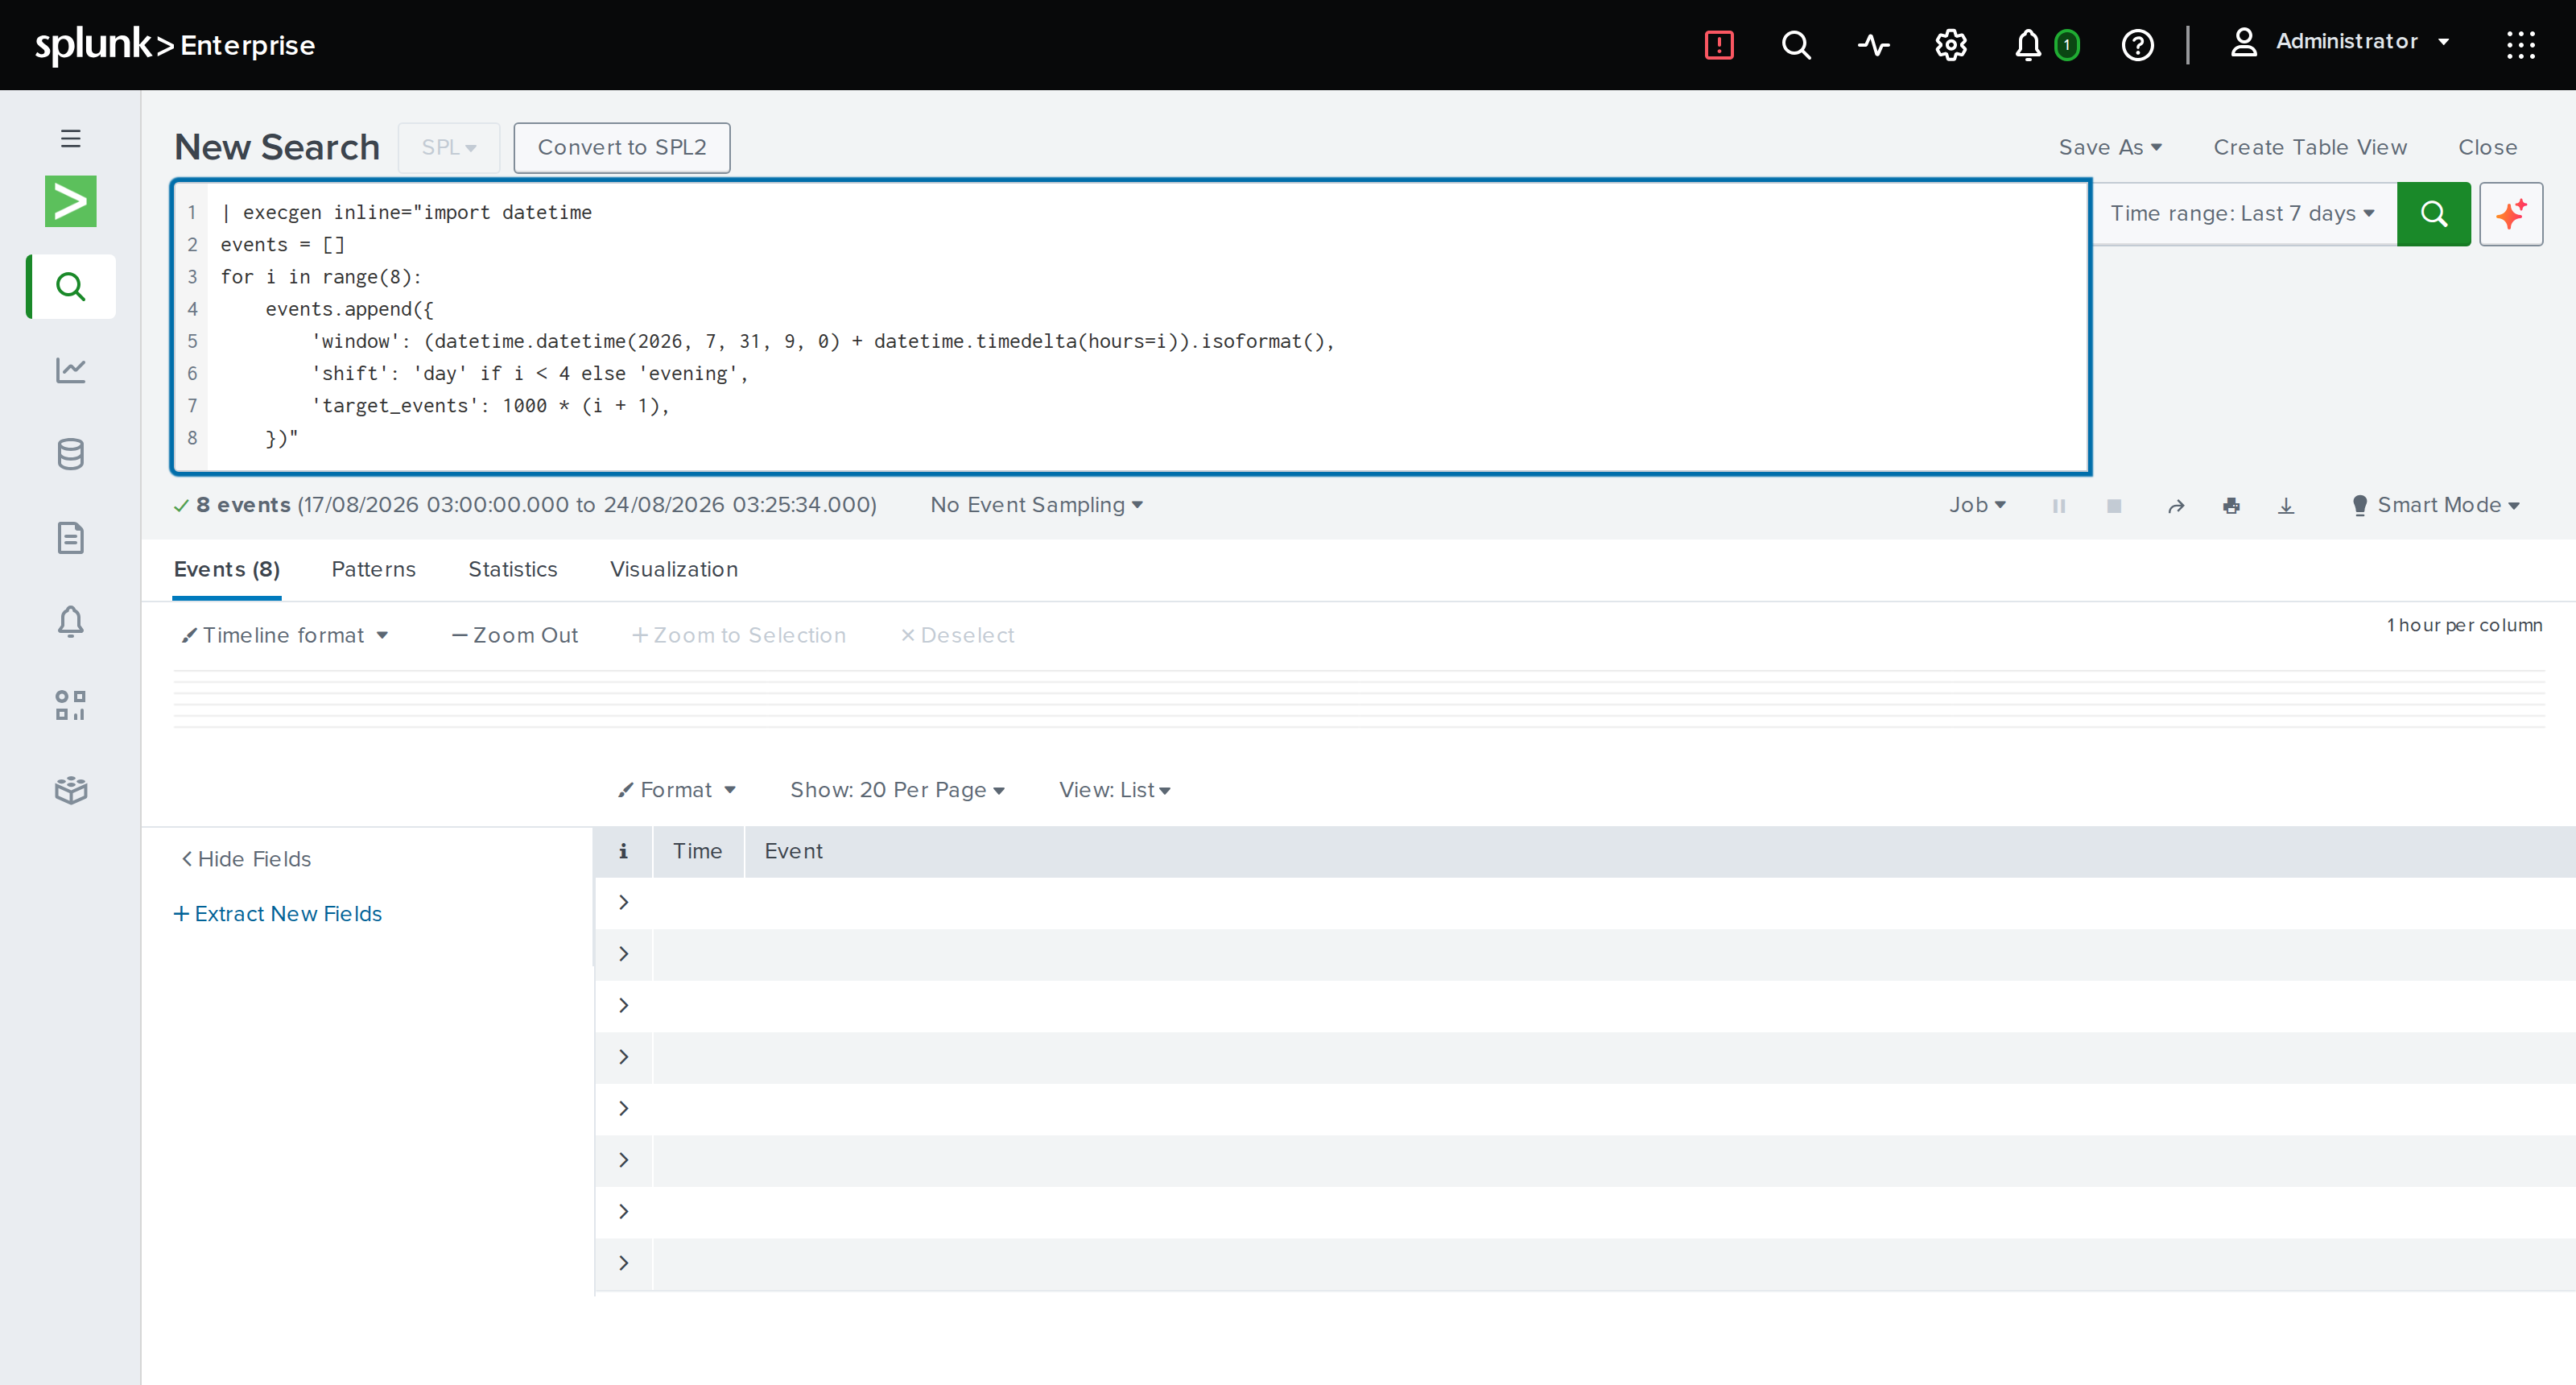
This is how you pull an external API into Splunk without writing a modular
input: call it in execgen, shape the response into a list of dictionaries,
and let the rest of the pipeline treat it like any other data.
5. Call a Compiled Function
When the logic is stable, or fast enough to matter, compile it. Drop a .wasm
component into functions/public/ and call it by name.
| makeresults count=4
| streamstats count as n
| exec function=example
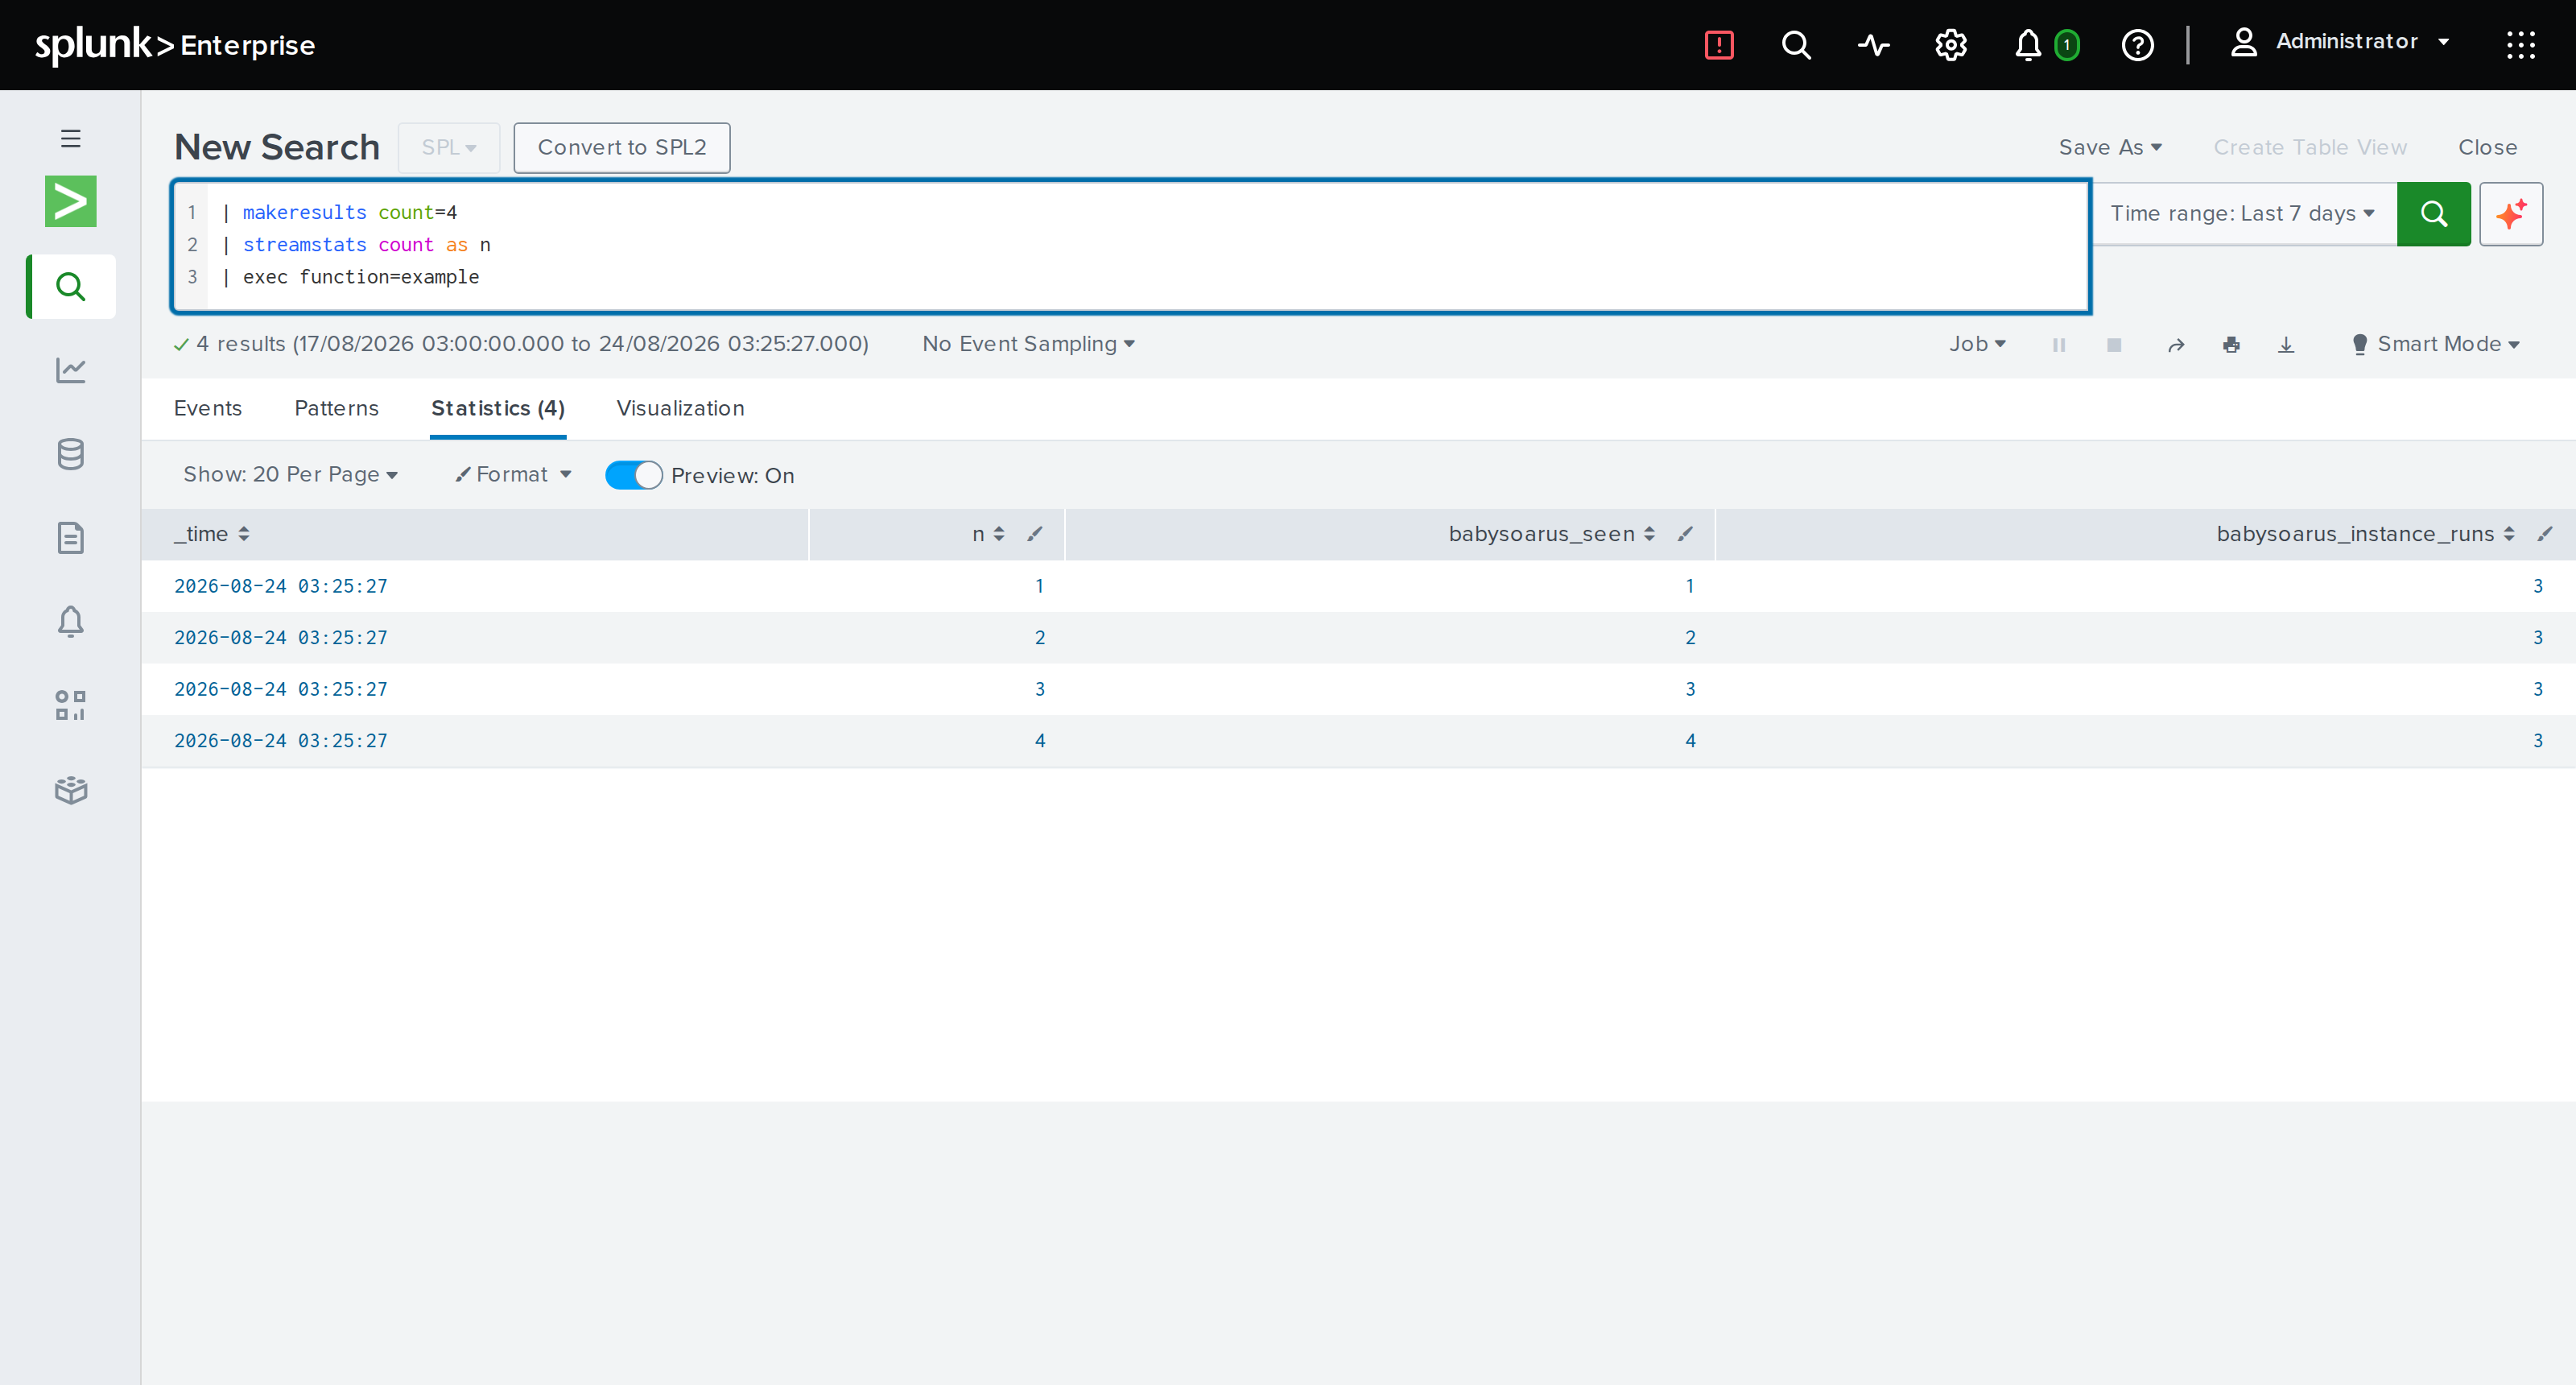
Compiled functions run many times faster than the interpreter and are version-controlled, reviewable and testable like any other code. See Custom WebAssembly functions.
Where to Go Next
- Inline Python is the full reference for the execution environment.
- Overview for SOC teams if you are here to build detections.
- Performance if you want to know what it costs.
Inline Python
- The Execution Model
- A Snippet Sees One Batch at a Time
- Names in Scope
- Everything Is a String
- Parameters from the Search
- Typing Fields Automatically
- Typing Against a Data Model
- Fields Have to Be Materialised First
- The Standard Library
- Calling Out
- The Splunk SDK
- Reading Lookups
- Errors
- Performance
- Limits
Everything the sandbox gives your snippet, and everything it does not.
The Execution Model
Events arrive in micro-batches, 32 at a time by default. For each batch your
snippet runs once, with events bound to that batch. The snippet is compiled
once per search, not once per batch, so a ten-million-event search parses your
source exactly once.
begin-run    compile the snippet, build the namespace     once per search
execute-batch  run the compiled code over one batch       once per 32 events
end-run      clear the namespace                          once per search
The namespace persists across batches within a search. That is deliberate and useful:
index=web
| exec inline="
try:
    seen
except NameError:
    seen = set()

for e in events:
    e['first_time_seen'] = e['dest_host'] not in seen
    seen.add(e['dest_host'])"
seen survives from batch to batch, so first-seen detection works across the
whole search rather than resetting every 32 events.
The namespace is cleared between searches. A pooled interpreter reused by somebody else's search never sees your variables, and never sees your credentials.
A Snippet Sees One Batch at a Time
This shapes more code than anything else on this page.
events holds 32 events, not the whole result set. Anything that needs a
global view has to happen either in SPL or across batches using the persistent
namespace.
Sorting. Sorting inside a snippet orders 32 events. Sort in SPL, after the command:
| exec inline="for e in events: e['score'] = compute(e)"
| sort - score
Totals and rankings. len(events) is the batch size, not the result
count. Aggregate with stats before the command, or accumulate across batches
and emit at the end.
Accumulating. When you build up findings across batches, emit only what each batch discovered, or every later batch re-emits everything found so far:
try:
    findings, emitted = [], 0
except NameError:
    pass

# ... append to findings ...

events = findings[emitted:]
emitted = len(findings)
Deduplicating. A set in the namespace works across the whole search, because the namespace persists between batches within one search.
Raising batch_size makes batches larger but never makes them the whole
result set. If you need everything at once, reduce with stats first.
Names in Scope
| Name | What it is |
|---|---|
events | The current micro-batch: a list of dictionaries. |
http_request(method, url, headers=None, body=None, timeout=30) | Outbound HTTP. Returns {'status', 'headers', 'body'}, where body is bytes. |
splunk_request(method, path, body=None, headers=None) | Splunk REST call using this search's credentials and base URL. |
service | An authenticated Splunk SDK Service, if the SDK is installed. See The Splunk SDK. |
search(spl, earliest='-24h', latest='now', mode='oneshot', cap=10000) | Run a search, get a list of dictionaries. Needs the SDK. |
kv(collection) | A KV store collection: get, find, insert, update, delete, batch_save. Needs the SDK. |
datamodel(name) | A Splunk data model: inspect its objects and fields, or conform() a batch to one. |
params | key=value arguments from the search, as a dictionary of strings. |
lookups_dirs() | List of guest paths where Splunk lookup files are mounted. |
auth_headers | This search's Splunk credentials, as a list of pairs. Deprecated: splunk_request no longer needs them. |
base_url | This Splunk instance's management URI. |
context | Run metadata: app, sid, owner, platform, generating. |
BabysoarusError | Raise it to fail the batch with a specific message. |
json, re, datetime, math, os, time | Pre-imported for convenience. |
Everything Is a String
Splunk's data model is text. A field that looks like a number arrives as
'42', and must be converted before arithmetic:
# Wrong: string concatenation, silently
e['total'] = e['bytes_in'] + e['bytes_out']

# Right
e['total'] = int(e['bytes_in']) + int(e['bytes_out'])
Multivalue fields arrive as a Python list of strings, and a list you assign becomes a multivalue field on the way back:
| makeresults
| eval tags=split("alpha,beta,gamma", ",")
| exec inline="for e in events: e['tag_count'] = len(e['tags'])"
Missing fields are simply absent from the dictionary, so use .get() when a
field is optional:
user = e.get('user', 'unknown')
Parameters from the Search
Any key=value on the command that is not inline, function, batch_size
or autocast is passed through to your code as params:
index=auth | exec function=detections/password_spray min_users=8 window=5m
threshold = int(params['min_users'])
window = params.get('window', '10m')
Values are strings, because that is what Splunk gives the command. Convert
what you need, and use .get() with a default for anything optional.
params is always defined, and empty when nothing was passed, so a snippet
does not have to guard for its absence.
This is what lets one function be tuned rather than copied. A detection whose threshold is a parameter is one function used at several sensitivities; a detection whose threshold is hard-coded becomes a new copy each time.
Typing Fields Automatically
autocast=true infers a type for each value instead, so arithmetic works
without converting first:
index=web | exec autocast=true inline="for e in events: e['total'] = e['bytes_in'] + e['bytes_out']"
It is off by default, and the rest of this page assumes it is off.
Values are inferred in this order: integer, float, boolean (true, false,
yes, no), ISO-8601 timestamp, then JSON object or array. Anything else
stays text. Multivalue fields are typed element by element.
Values that only look like numbers are deliberately left alone, because turning them into numbers would destroy them:
| Value | Result | Why |
|---|---|---|
007 | text | Leading zeros mean it is an identifier, not a quantity |
1_0 | text | Python would read this as 10 |
123456789012345678 | text | Too long to survive as a JSON number exactly |
1e400 | text | Larger than a float can hold |
1 | integer, not True | A bare 1 in Splunk data is nearly always a count |
1755300000 | integer, not a date | A bare epoch is nearly always an identifier |
_raw, _time and every other field beginning with an underscore are never
touched, because they belong to Splunk rather than to your data.
Two things worth knowing before you turn it on. A timestamp comes back out in
full ISO-8601 form, so 2026-08-16 leaves as 2026-08-16T00:00:00. And a
field is typed per value, so a field holding 7 in one row and n/a in the
next gives you an integer and a string. That is deliberate: Splunk has no
per-field schema, and a micro-batch is too small a sample to decide one from.
Holding a Type for the Whole Search
autocast=strict fixes each field's type from the first batch and keeps it,
rather than deciding per value:
index=web | exec autocast=strict inline="for e in events: e['ratio'] = e['bytes'] / 1024"
A later value that does not fit the fixed type is left as text and named in a
babysoarus_autocast_failed field, so the row is still returned and the problem
is visible rather than silent:
n     babysoarus_autocast_failed
5
n/a   n
A field whose first batch was text stays text, and values that later look numeric are not reported: keeping them as text is the correct outcome, not a failure.
Typing Against a Data Model
autocast infers a type from the value. A data model declares it, which
resolves cases inference cannot:
index=_audit
| exec inline="
obj = datamodel('internal_audit_logs').object('Audit.searches')
obj.conform(events)
for e in events:
    e['slow'] = e['total_run_time'] > 10"
conform() coerces every field the model declares to its declared type, in
place. Fields the model does not name are left alone, because a batch usually
carries more than the model describes.
Because the model has stated the type, values that autocast deliberately
leaves as text become what the schema says they are: 1 is a boolean where
the model says boolean, 1755300000 is a timestamp where it says timestamp,
and 007 is the number 7 where it says number.
When a Value Does Not Fit
The value is kept exactly as it arrived and named in a
babysoarus_conformance field:
total_run_time  is_realtime  babysoarus_conformance
not-a-number    perhaps      total_run_time:expected number,is_realtime:expected boolean
Losing your data to make a schema look satisfied would be the wrong trade, so
nothing is dropped or replaced. A required field that never arrived is
reported as missing rather than invented.
Inspecting a Model
m = datamodel('internal_audit_logs')
m.objects                      # ['Audit', 'Audit.modify', 'Audit.searches']
obj = m.object('Audit.searches')
obj.fields['action'].type      # 'string'
obj.required                   # field names the model marks required
obj.spl()                      # | from datamodel:"internal_audit_logs.Audit.searches"
Definitions are fetched once per search and reused, so calling datamodel()
inside a per-event loop costs one request rather than one per event.
Calculated fields are part of the schema. Splunk has already evaluated them by the time a batch arrives, so what matters here is their declared type, not the order they were calculated in.
Fields Have to Be Materialised First
This one surprises everybody once.
Splunk only materialises search-time extracted fields that something in the
pipeline actually references. Your snippet is opaque to Splunk, so it has no
way of knowing that you are about to read e['action'], and the field arrives
missing.
# `action` is extracted from _raw at search time, and nothing mentions it,
# so the snippet sees nothing.
index=auth | exec inline="for e in events: e['x'] = e.get('action', 'MISSING')"
Name the fields you need before the exec:
index=auth
| fields _time user src_ip dest action
| exec inline="for e in events: e['x'] = e['action']"
Or take everything, which is simpler and more expensive:
index=auth | fields + * | exec inline="..."
This does not apply after stats, table, eval or anything else that has
already materialised the fields it produces, which is why most examples do
not need it. It applies when a snippet reads extracted fields straight off raw
events.
If a field is unexpectedly missing, this is almost always why.
The Standard Library
The interpreter is CPython 3.14, so everything the language offers up to
that version is available: structural pattern matching, the walrus operator,
f-strings, dataclasses, zoneinfo. You are not writing to an older dialect.
The version does not follow whichever Python you used to build the app. It is fixed by the interpreter that componentize-py embeds, and it is the same on every search head running the same build.
Most of the standard library is available and importable as usual:
| exec inline="import csv, hashlib, base64, ipaddress, statistics, urllib.parse
for e in events:
    e['sha'] = hashlib.sha256(e['raw'].encode()).hexdigest()
    e['is_private'] = ipaddress.ip_address(e['src_ip']).is_private"
csv, hashlib, base64, binascii, bisect, calendar, codecs,
collections, copy, datetime, decimal, difflib, fnmatch,
fractions, functools, gzip, heapq, hmac, html, io, ipaddress,
itertools, json, math, operator, os.path, pathlib, pprint,
queue, random, re, secrets, shlex, statistics, string, struct,
textwrap, time, types, typing, unicodedata, urllib.parse, uuid,
xml.etree.ElementTree and zlib are all present.
Modules must be baked in at build time. The interpreter is a WebAssembly component whose imports are resolved when it is built, so
importat search time can only find modules that were imported when the component was compiled. Importing anything else raisesModuleNotFoundError. To add one, see Dependencies.
Calling Out
http_request returns a dictionary. The body is bytes, so decode it or hand
it to json.loads, which accepts either.
r = http_request(
    'POST',
    'https://intel.example.internal/api/v2/lookup',
    headers={'Authorization': 'Bearer ' + token, 'Content-Type': 'application/json'},
    body={'indicators': [e['dest_host'] for e in events]},   # a dict is JSON-encoded
    timeout=10,
)
if r['status'] != 200:
    raise BabysoarusError(f"intel API returned {r['status']}")
verdicts = json.loads(r['body'])
Call it once per batch, outside the for loop, wherever the API supports
it. One request carrying 32 indicators beats 32 requests carrying one.
splunk_request fills in the credentials and base URL for you:
r = splunk_request('GET', '/services/authentication/current-context?output_mode=json')
Guest HTTP honours the daemon's proxy environment, except for loopback addresses, which are never proxied. Certificates are fully verified, except for Splunk's own management endpoint on loopback, whose default certificate is self-signed. See Security model.
The Splunk SDK
splunk_request is deliberately low-level. For anything beyond a call or two,
install the official Splunk SDK and use service, which is already
authenticated for the current search:
{ "packages": [{ "name": "splunk-sdk", "version": "3.0.0" }] }
Put that in config/packages.json (see Dependencies),
restart the daemon, and service works:
| makeresults
| exec inline="
for e in events:
    e['saved_searches'] = [s.name for s in service.saved_searches]
    e['version'] = service.info['version']"
service is a normal splunklib.client.Service, so the SDK's own
documentation applies: service.saved_searches, service.kvstore,
service.jobs, service.apps and the rest.
Three things are worth knowing about it.
It costs nothing until you touch it. The object in scope is a placeholder;
the SDK is imported and the connection prepared on first attribute access. A
snippet that never mentions service pays nothing, and a deployment without
the SDK installed still runs every other snippet. Reaching for it without the
SDK gives you an error saying exactly what to add and where.
It never holds your credentials. The SDK's HTTP handler is replaced with
one that routes through the host, which resolves the endpoint against this
search's base URL and attaches the credentials on the far side of the sandbox
boundary. service.token reads <injected by the BabySOARus host>, because that
is genuinely all the sandbox knows. Snippet code cannot leak a Splunk token it
was never given, nor point the SDK at a different server.
It talks to this Splunk instance only. For anything else, use
http_request, which is subject to the network policy.
Searching from a Search
search() wraps the SDK for the common case: run some SPL, get rows back.
| makeresults
| exec inline="
rows = search('index=_internal | head 100 | stats count by sourcetype', earliest='-1h')
for e in events:
    e['sourcetypes'] = len(rows)"
It returns a list of dictionaries. Three of its defaults are opinions worth knowing:
- The time range defaults to the last 24 hours. The SDK applies no default
at all, and an accidental all-time search launched from inside another search
is a good way to hurt a search head. Pass
earliest=Noneif you mean it. - Results are capped at 10,000 rows, for the same reason. Pass
cap=Noneto lift it. - A leading
searchis added if your SPL does not start with a command, sosearch('index=main')works rather than failing on syntax.
mode='export' streams instead of buffering, for result sets too large to hold
in memory. mode='job' creates a job and waits for it.
The KV Store
kv(name) gives a collection with the paging and chunking handled:
| makeresults
| exec inline="
watchlist = kv('threat_hosts')
watchlist.batch_save([{'host': h, 'score': 90} for h in ('a.example', 'b.example')])
hits = watchlist.find(query={'score': {'\$gte': 80}})
for e in events:
    e['high_risk'] = len(hits)"
| Method | Does |
|---|---|
get(key) | One document by _key, or None if absent. |
find(query=, sort=, limit=, skip=, fields=) | Documents matching a MongoDB-style query. |
insert(doc) | Adds one, returns its _key. |
update(key, doc) | Replaces one. |
delete(key=) / delete(query=) / delete() | Removes one, some, or all. |
batch_save(docs) | Saves many. |
Two limits are handled for you, because Splunk enforces them and the SDK does
not mention them. A query returns at most 50,000 rows per call, so find()
pages until it has everything. Without that, a collection of 60,000 documents
returns 50,000 and looks complete. And batch_save accepts 1,000 documents per
call, so it chunks; exceeding that limit is an error rather than a truncation.
The collection must exist. Declare it in collections.conf, or create it once
with service.kvstore.create('name').
Reading Lookups
Lookup directories are mounted read/write inside the sandbox:
| exec inline="import csv
with open('/lookups/apps/search/asset_owners.csv') as handle:
    owners = {row['ip']: row['owner'] for row in csv.DictReader(handle)}
for e in events:
    e['owner'] = owners.get(e['src_ip'], 'unassigned')"
Load the file once per search by guarding it, as with seen above, rather
than re-reading it on every batch.
lookups_dirs() returns the mounted paths, which are /lookups/system and
/lookups/apps/<app> for every app that has a lookups directory.
Errors
Raise BabysoarusError for a message you want an analyst to read:
if r['status'] == 429:
    raise BabysoarusError('threat intel API rate limit reached; reduce the time range')
Any other exception is reported too, with its type and message. What reaches Splunk describes your snippet, not the internals of the executor.
An error fails the current batch. Earlier batches in the same search have already been emitted, which is what streaming means.
Performance
The sandbox boundary is cheap relative to the work most snippets do, so for most searches your logic is the cost rather than the boundary.
Three habits keep it that way:
Hoist work out of the loop. Compiling a regular expression, parsing a
lookup, or calling an API belongs outside for e in events.
Raise batch_size for expensive setup. batch_size=512 amortises
per-batch work over more events. Lower it towards 1 for the fastest possible
first result.
Compile the hot path. If a snippet is stable and the search is enormous, a
custom function is faster by an order of magnitude or
more -- make bench reports the exact factor for your hardware.
Limits
- 30 seconds of execution per micro-batch, then the guest is interrupted.
Tune with
BABYSOARUS_TIMEOUT_EXECUTE_SECS. - No sockets, no subprocesses, no
import socket. - No filesystem beyond the mounted lookup directories.
- No environment variables.
- 64 MB cap on an HTTP response body.
Custom WebAssembly Functions
- When to Compile
- The Contract
- A Worked Example
- State and Pooling
- Other Languages
- Legacy Modules Are Not Supported
- Saved Python Functions
- Hot Reload
- Testing
When a snippet is stable, hot, or too big for the search bar, compile it.
A custom function is a WebAssembly component you drop into
functions/public/. It becomes callable before your next search, with no
restart, and runs many times faster than the interpreter -- a factor
make bench in Performance
will put a number on for your own hardware.
index=web | exec function=enrich.wasm
When to Compile
| Use inline Python | Use a compiled function |
|---|---|
| Exploring, hunting, iterating | Logic that has settled |
| A few lines | A few hundred lines |
| Anything you will change today | Anything under change control |
| Interpreter throughput is plenty | You are counting microseconds |
| Standard library is enough | You want a real dependency tree |
Most detections never need compiling. Reach for it when the logic deserves a test suite and a code review.
The Contract
Three exported functions, defined in wit/exec.wit:
export begin-run: func(code: option<string>) -> result<_, string>;
export execute-batch: func(batch-json: string) -> result<string, string>;
export end-run: func() -> result<_, string>;
execute-batch receives a JSON array of event objects and returns a JSON
array of event objects. Return fewer to filter, more to expand.
The host offers three imports: splunk-request, get-lookups-dirs and
get-run-context. General outbound HTTP is not one of them: it is
wasi:http/outgoing-handler, which the world also imports, so your requests
are subject to the network policy the daemon configures.
A Worked Example
The app ships this example compiled, as functions/public/example.wasm.
Here is the complete implementation it was built from:
wit_bindgen::generate!({ path: "../../wit", world: "exec", generate_all });

use crate::babysoarus::exec::host;
use std::cell::RefCell;

struct Component;
export!(Component);

#[derive(Default)]
struct RunState {
    seen: u64,
    started: bool,
}

thread_local! {
    static STATE: RefCell<RunState> = RefCell::new(RunState::default());
}

impl Guest for Component {
    fn begin_run(_code: Option<String>) -> Result<(), String> {
        STATE.with(|s| *s.borrow_mut() = RunState { seen: 0, started: true });
        Ok(())
    }

    fn execute_batch(batch_json: String) -> Result<String, String> {
        let mut records: Vec<serde_json::Map<String, serde_json::Value>> =
            serde_json::from_str(&batch_json).map_err(|e| e.to_string())?;

        for record in &mut records {
            let seen = STATE.with(|s| {
                let mut s = s.borrow_mut();
                s.seen += 1;
                s.seen
            });
            record.insert("babysoarus_seen".into(), seen.into());
        }

        serde_json::to_string(&records).map_err(|e| e.to_string())
    }

    fn end_run() -> Result<(), String> {
        STATE.with(|s| s.borrow_mut().started = false);
        Ok(())
    }
}
Build it:
cd components/babysoarus-guest-example
cargo build --release --target wasm32-wasip2
cp target/wasm32-wasip2/release/babysoarus_guest_example.wasm \
   "$SPLUNK_HOME/etc/apps/babysoarus/functions/public/enrich.wasm"
Call it:
| makeresults count=4 | streamstats count as n | exec function=enrich

State and Pooling
Instances are pooled and reused across unrelated searches. That is what makes them cheap, and it shapes how you should write them.
Per-run state belongs in begin-run and must be cleared in end-run.
Anything a search puts there must not leak to the next search.
Instance state survives across runs and is exactly where the value is. Compiled regular expressions, parsed lookup tables, prepared automata: build them once, on first use, and every later search reuses them for free.
thread_local! {
    // Built once per instance, reused by every search that instance serves.
    static PATTERN: regex::Regex = regex::Regex::new(r"(?i)cmd\.exe\s+/c").unwrap();
}
If a call traps, the host discards that instance rather than returning it to the pool, because guest globals could be in any state. You do not need to handle that yourself.
Other Languages
Any toolchain that targets the component model works.
Rust with wit-bindgen and the wasm32-wasip2 target, as above. No
cargo-component needed on recent Rust.
Python with componentize-py, which is how the bundled interpreter is
built. Useful when you want the deployment story of a compiled function but
the ergonomics of Python.
Go with TinyGo and wit-bindgen-go.
JavaScript with ComponentizeJS.
C and C++ with wasi-sdk and wit-bindgen.
There Is No Upload Button
Whatever the toolchain, the result is one .wasm file, and there is
deliberately only one way it gets into BabySOARus: copy it into
functions/public/ or functions/private/ on the app's own filesystem, the
same way the worked example above does with cp. The browser editor's Save
button is for the Python source it edits, not for a compiled binary -- a
component you built elsewhere reaches the daemon through the same deployment
path as the rest of the app: a Git checkout, splunk install app, a config
management push, whatever already puts files on this Splunk instance. Once
the bytes are on disk, hot reload below picks it up with no
restart, exactly like any other file change.
Legacy Modules Are Not Supported
Plain WASI Preview 1 core modules, including anything exporting a raw
process(ptr) -> ptr C ABI as described in this project's older example
documentation, will not load. Rebuild against a component-model target.
This is deliberate. Supporting Preview 1 means carrying an adapter module in every instance, which costs memory in the pool and adds a compatibility surface with its own bugs. Every component here is a genuine Preview 2 component backed by a single core instance.
Saved Python Functions
Most saved functions are written in the editor, in Splunk
Web, not by placing a file on disk directly. The two are the same thing
underneath -- a saved function is still a .py file in functions/public/
or functions/private/, callable the same way a .wasm component is: writing
the file straight to disk (a deployer's Git checkout, a bulk import) is the
right path for those cases, and everything below still applies to it exactly.
index=auth | exec function=detections/password_spray min_users=8
The file defines process:
# functions/public/detections/password_spray.py
def process(events, params):
    threshold = int(params.get('min_users', '5'))
    for e in events:
        e['over'] = int(e['count']) > threshold
    return events
params is optional. Write def process(events): when you do not need
it; both signatures are accepted.
Return a list to replace the batch, or return nothing having changed
events in place. This is the same rule an inline snippet follows.
Sharing Code Between Functions
A file without a process is an ordinary module. Import it from any other
saved function:
# functions/public/lib_scoring.py
def score(value):
    return len(str(value)) * 10
# functions/public/detections/password_spray.py
import lib_scoring

def process(events):
    for e in events:
        e['score'] = lib_scoring.score(e['user'])
Calling a module that has no process as a function reports exactly that,
rather than failing obscurely.
Names Are Paths
A function is named by its path under the functions directory with the
extension dropped, so functions/public/detections/password_spray.py is
function="detections/password_spray". Folders are how you organise a
library; two functions of the same name in different folders are distinct.
Names use forward slashes, and a name that would point outside the functions directory is refused.
When Two Files Share a Name
Functions live in three layers. In increasing precedence: functions/library/,
the read-only detections shipped with the app; then functions/public/; then
functions/private/. A name claimed in more than one layer resolves to the
highest, so your own copy of a shipped detection replaces it without your
having to rename anything. Within a single layer, a .py beats a .wasm of
the same name.
Overriding a shipped detection is the point of that ordering, so a collision is reported rather than refused. The daemon logs every name more than one file claims, saying which one runs and which are inert, and the editor's file list marks a saved function that shadows a library entry. Worth knowing when an upgrade adds a detection whose name you were already using: yours keeps running, and the new one will not.
Editing Takes Effect Immediately
Save a file and the next search uses it. No restart, and no need to think about which warm interpreter served the last search. That applies to helper modules too, not just the function you called.
Hot Reload
The daemon watches functions/public/ and functions/private/.
- Adding a
.wasmfile makes it callable without a restart. - Replacing one swaps it atomically. Searches already running finish against the old code; new searches get the new code.
- Deleting one makes it stop resolving.
- Touching one without changing its bytes does nothing, because reloads are guarded by a content hash. Editors that rewrite files harmlessly are harmless.
Compiled artefacts are cached by content hash under var/cwasm/, so
reinstalling a component you have used before skips compilation entirely, even
across daemon restarts.
Testing
Test the component directly, with no Splunk in the loop. BabySOARus's own
test suite does exactly this to the shipped example: load the component, call
begin-run, feed it batches, assert on what comes back. Your harness can be
as small as a script that does those three things.
That is the real advantage of compiling. A detection becomes a unit test.
The Editor
- The File Tree
- Writing Code
- Version History
- Testing without Leaving the Browser
- The Debugger
- Metadata
- Coverage
- Reaching Every Search Head
Saved Python functions are normally written in the browser, not on disk. Open the BabySOARus view in Splunk Web to get a file tree on the left and a code pane on the right, with three panels that toggle underneath it: Tests, Debug and Details.
Editing a file on disk directly (over scp, in a deployer's Git checkout) still
works exactly as Custom WebAssembly functions
describes, and is the right path for bulk import or a GitOps workflow. This page
covers the other path: the one most detections actually get written through.
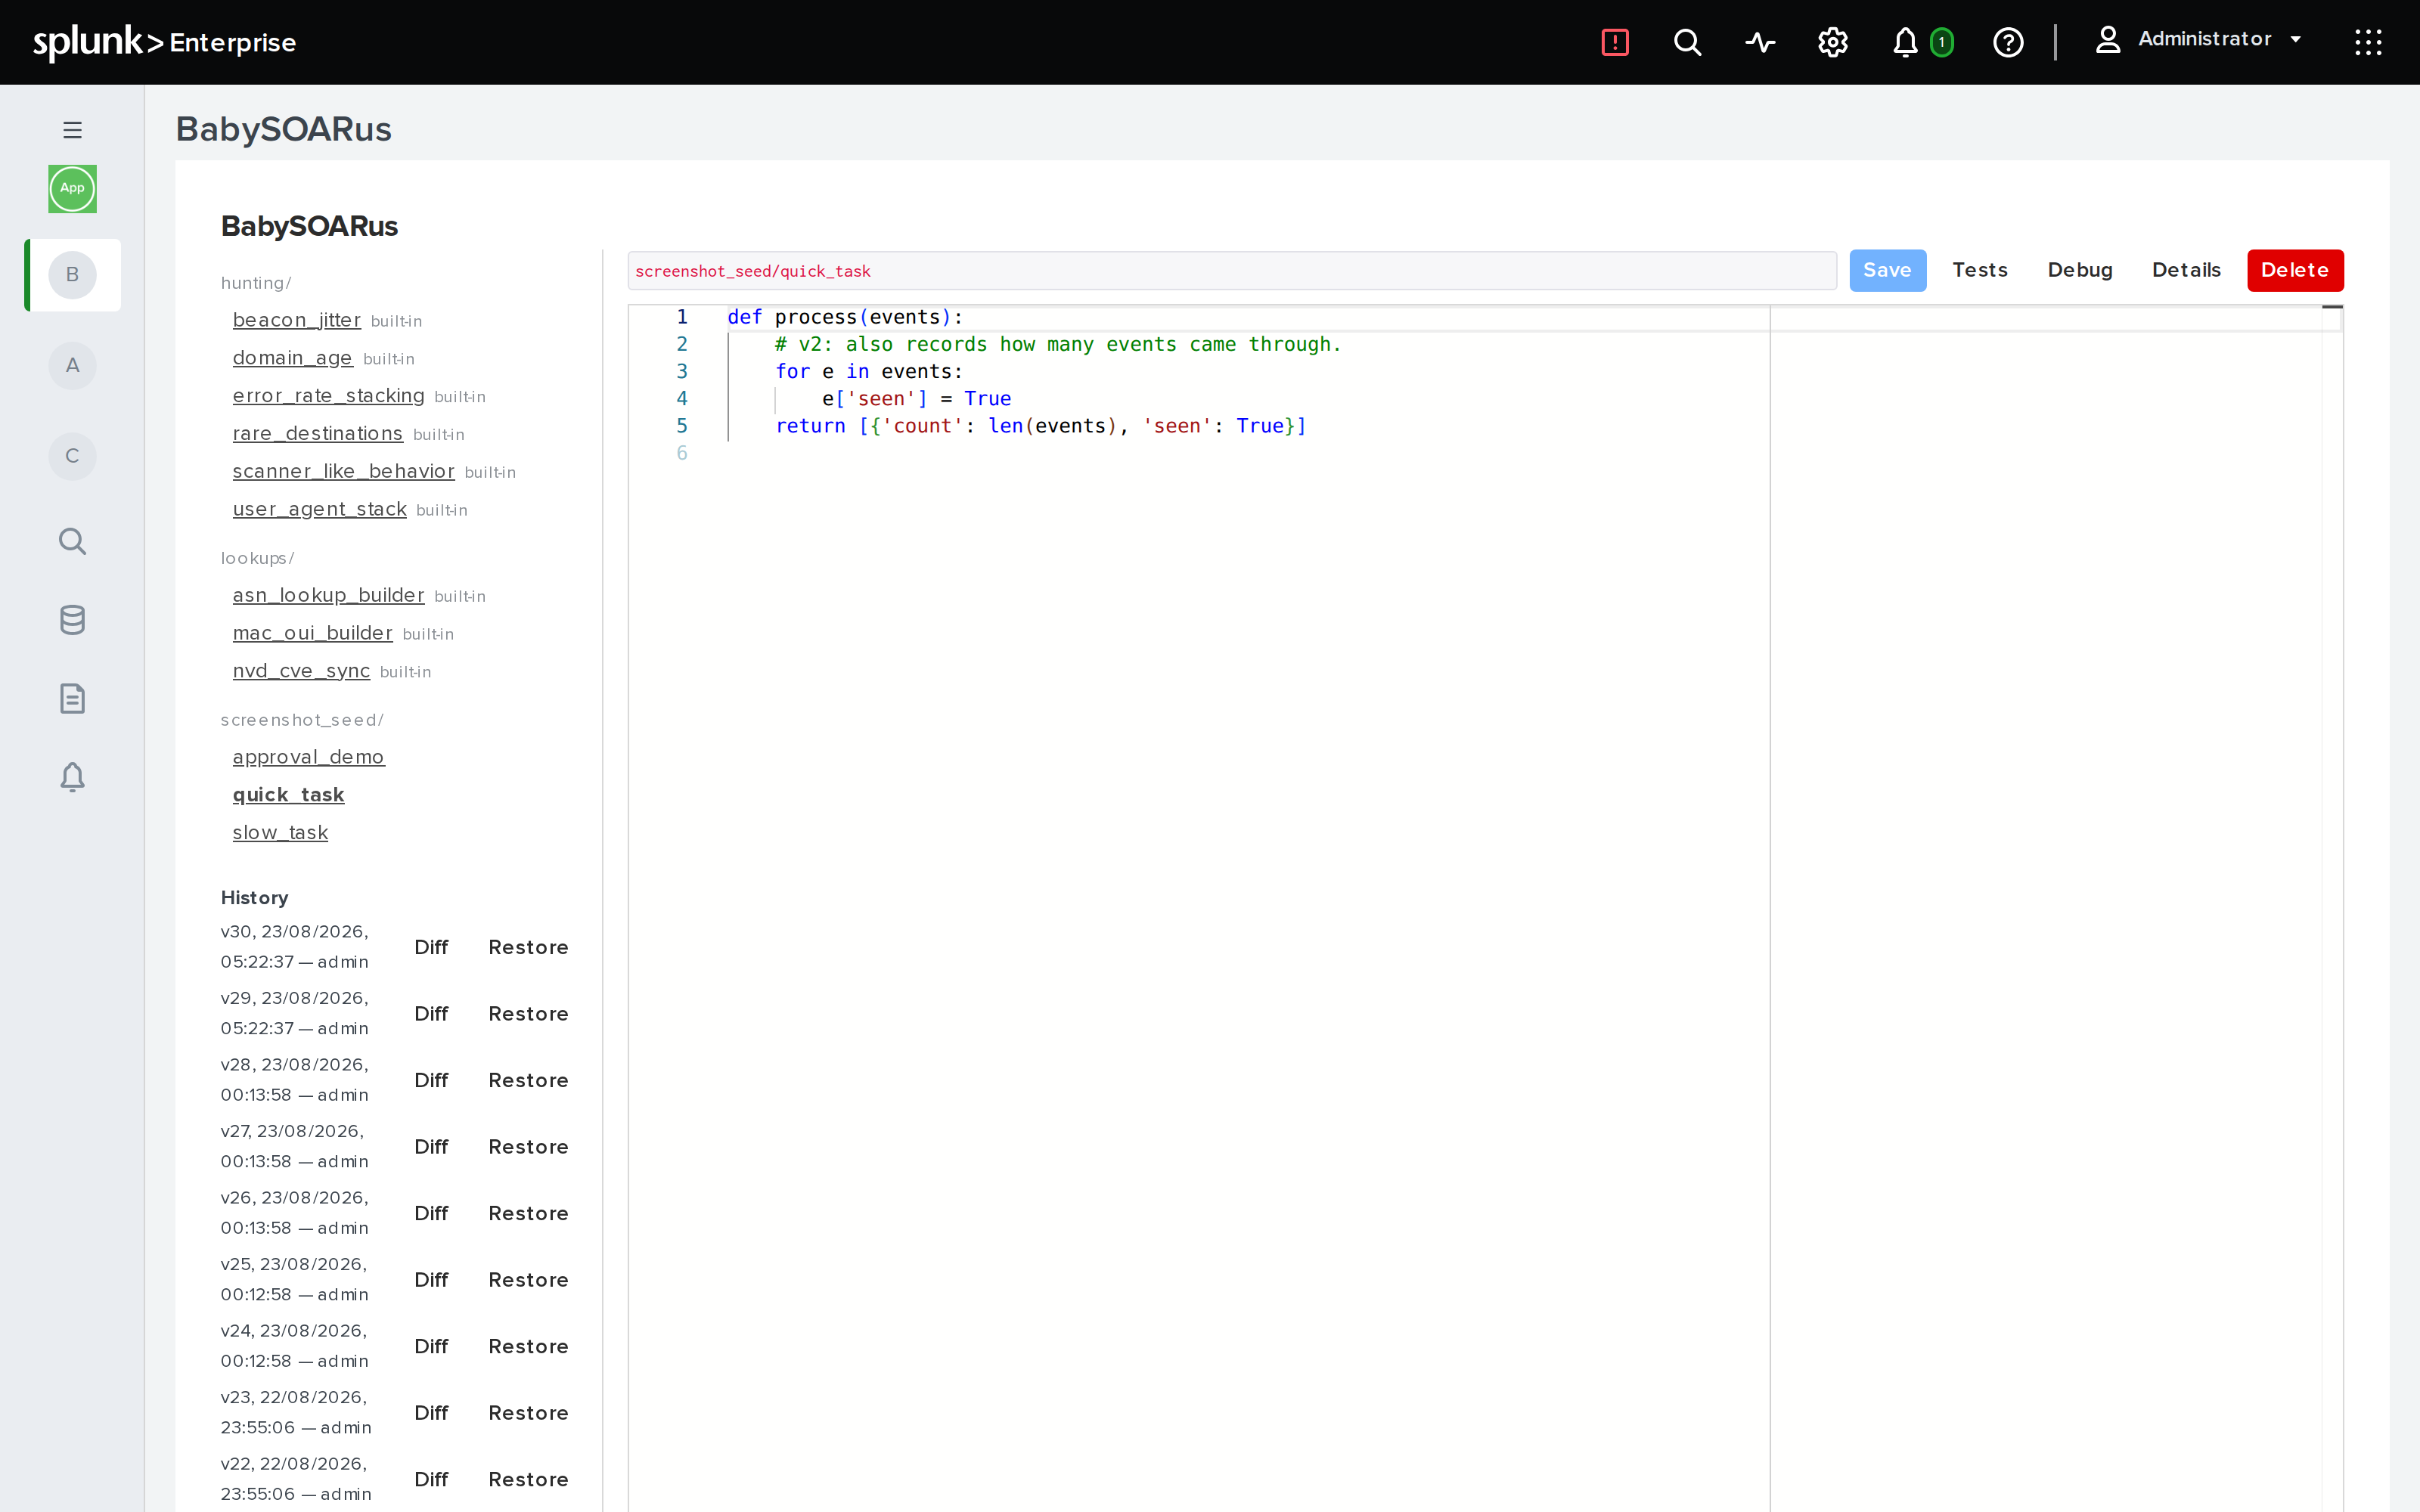
The File Tree
A function's identity is its path, exactly as on disk: detections/password_spray
is one function, regardless of whether it lives under functions/private/,
functions/public/, or is a built-in shipped with the app. There is no real folder
structure to create -- typing a slash-containing name in the New modal is what
makes a folder appear in the tree, the same [A-Za-z0-9_.-] segment rule the
daemon itself enforces applies client-side too.
A built-in library entry opens read-only, labelled built-in, with Edit a
copy in place of Save. Clicking it does not save anything by itself -- it
switches the editor to an editable local copy that still needs its own Save before
it exists. Until then, | exec function=... keeps using the built-in version.
Writing Code
The editor is Monaco, configured for Python: four-space indents, an 88-column ruler, no minimap. Autocomplete and diagnostics are not a static snippet list -- they run jedi and pyflakes/pycodestyle inside the same sandbox the code itself executes in, so completions see the real standard library and whatever your own saved modules define, 400 ms after you stop typing.
Saving is explicit, not automatic. Ctrl-S or the Save button, and only once
the buffer differs from what was last saved -- there is no autosave, and no live
effect on running searches from typing alone. A beforeunload warning covers the
one real risk this creates: navigating away, or closing the tab, with unsaved
changes.
Every save creates a new version, never an overwrite. The response after saving
says as much: "Saved <path> as version N." That version history, not the
current buffer alone, is what restore works from.
Version History
The sidebar below the file tree lists every version of the open function: number, timestamp, author, with Diff and Restore next to each. Diff always compares that one past version against the current buffer, not two arbitrary versions against each other. Restore reopens the file with that version's content loaded -- itself recorded as a new version once you save, not a silent rewrite of history.
Testing without Leaving the Browser
The Tests panel edits fixtures as raw JSON, deliberately the same shape as the
test.json files the built-in library ships:
{
  "function": "detections/password_spray",
  "events": [
    { "src_ip": "203.0.113.9", "users_targeted": "12", "attempts": "24", "targets": ["a", "b", "c"] }
  ],
  "expect": { "count": 1, "contains": [{ "pattern": "password spray", "severity": "high" }] }
}
A test written here can be committed to disk and run by babysoarus-ci unchanged --
there is no second, UI-only format to keep in sync.
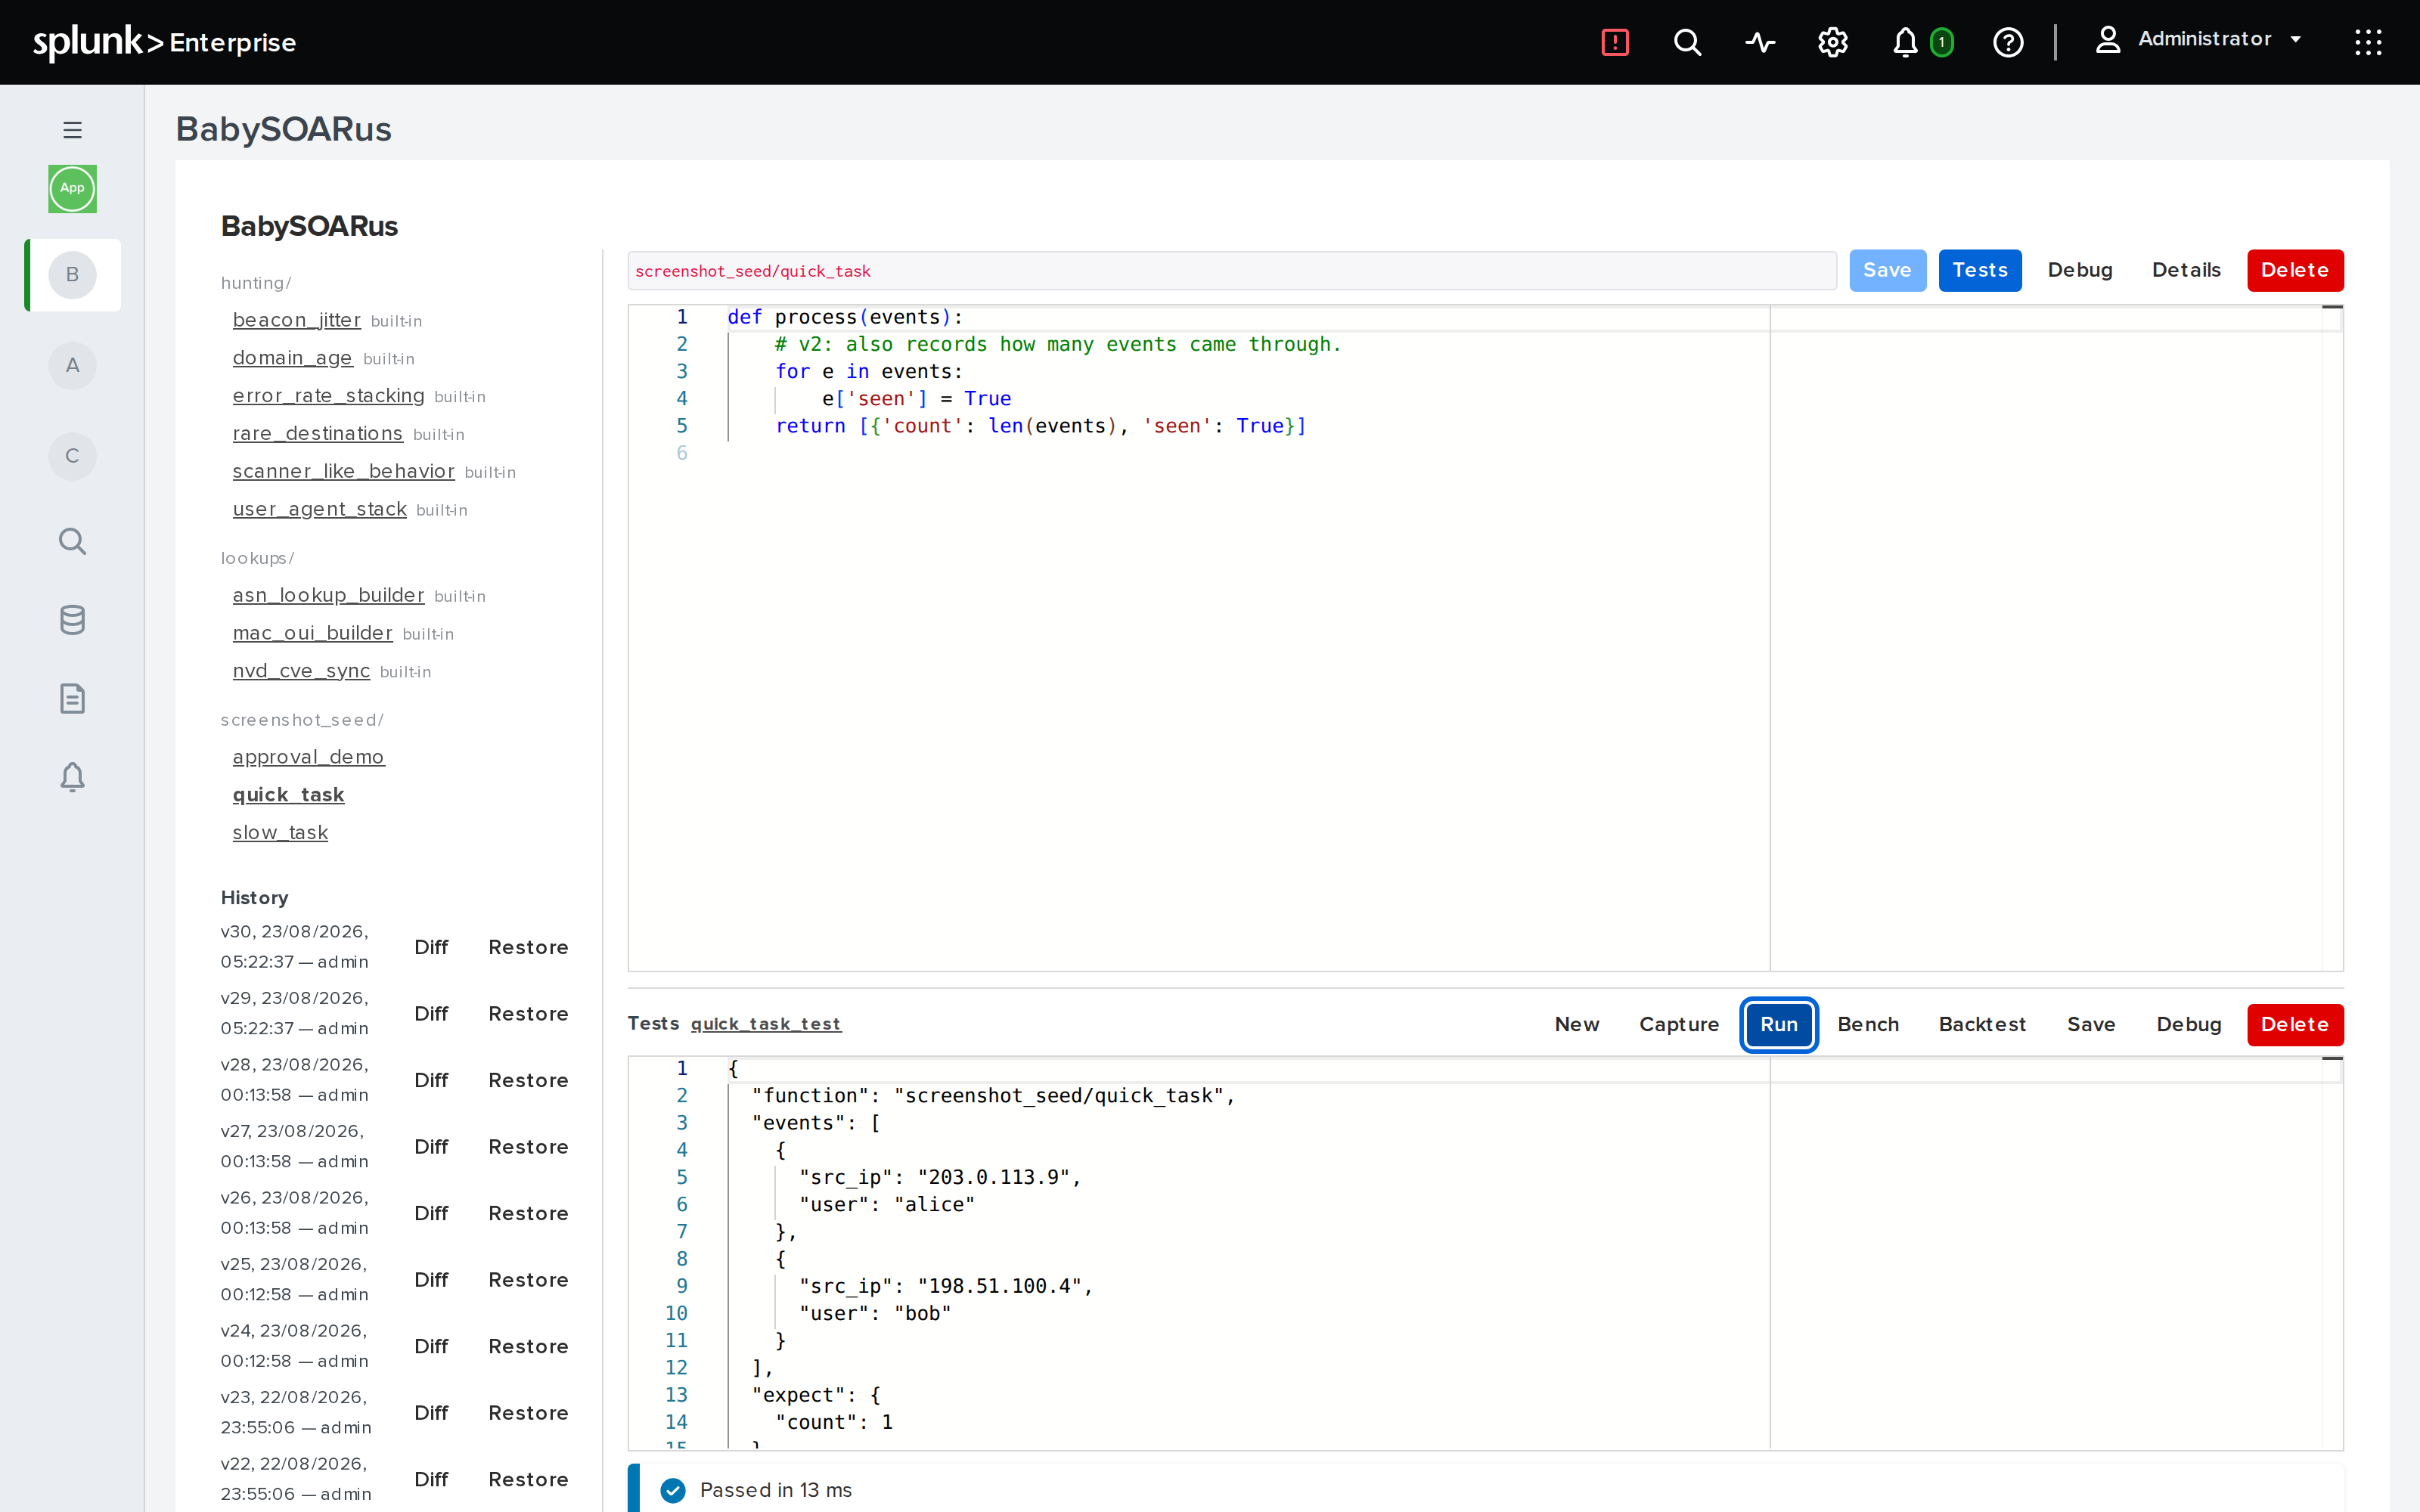
Run and Bench send the test body inline rather than by name, so they exercise whatever is currently in the editor, saved or not -- there is no save-before-run step to remember. Run reports pass/fail with the specific record/field/value a failure involved, plus captured stdout and stderr. Bench reports median, p10 and p90 timings per batch and per event, alongside a noise floor percentage and a warning if the machine looks too busy to trust the numbers.
Testing a function that calls out
A function that enriches from a vendor API cannot be tested by running it: the
test would need credentials, an internet connection, and a vendor whose data
never changes. A mocks field on the same JSON definition replaces the network
for that run:
{
  "inline": "...",
  "events": [{ "host": "SRV-002" }],
  "mocks": [
    { "method": "GET", "url": "https://api.example.com/devices?*",
      "status": 200, "body": "{\"value\": [{\"name\": \"SRV-002\"}]}" }
  ]
}
url matches exactly, or as a prefix when it ends in * -- which is what makes
a mock survive an endpoint that carries a timestamp or a generated filter in its
query string. method is optional and matched case-insensitively.
Two things are worth knowing. When any mock is given, the network is replaced
entirely: a request nothing matches fails naming both the URL asked for and
the ones this test was prepared for, rather than escaping to the real host. And
that includes splunk_request, so Splunk's own REST API is mockable too --
which is the only way to test a connector past its "no credentials configured"
branch, since the credentials themselves come from the password store over that
same call:
{ "method": "GET",
  "url": "https://splunk.invalid:8089/servicesNS/nobody/babysoarus/storage/passwords*",
  "status": 200,
  "body": "{\"entry\": [{\"content\": {\"clear_password\": \"test-token\"}}]}" }
splunk.invalid is the base URL a mocked run resolves relative Splunk paths
against. It is deliberately unroutable, so a Splunk call you forgot to mock
fails loudly instead of reaching something real.
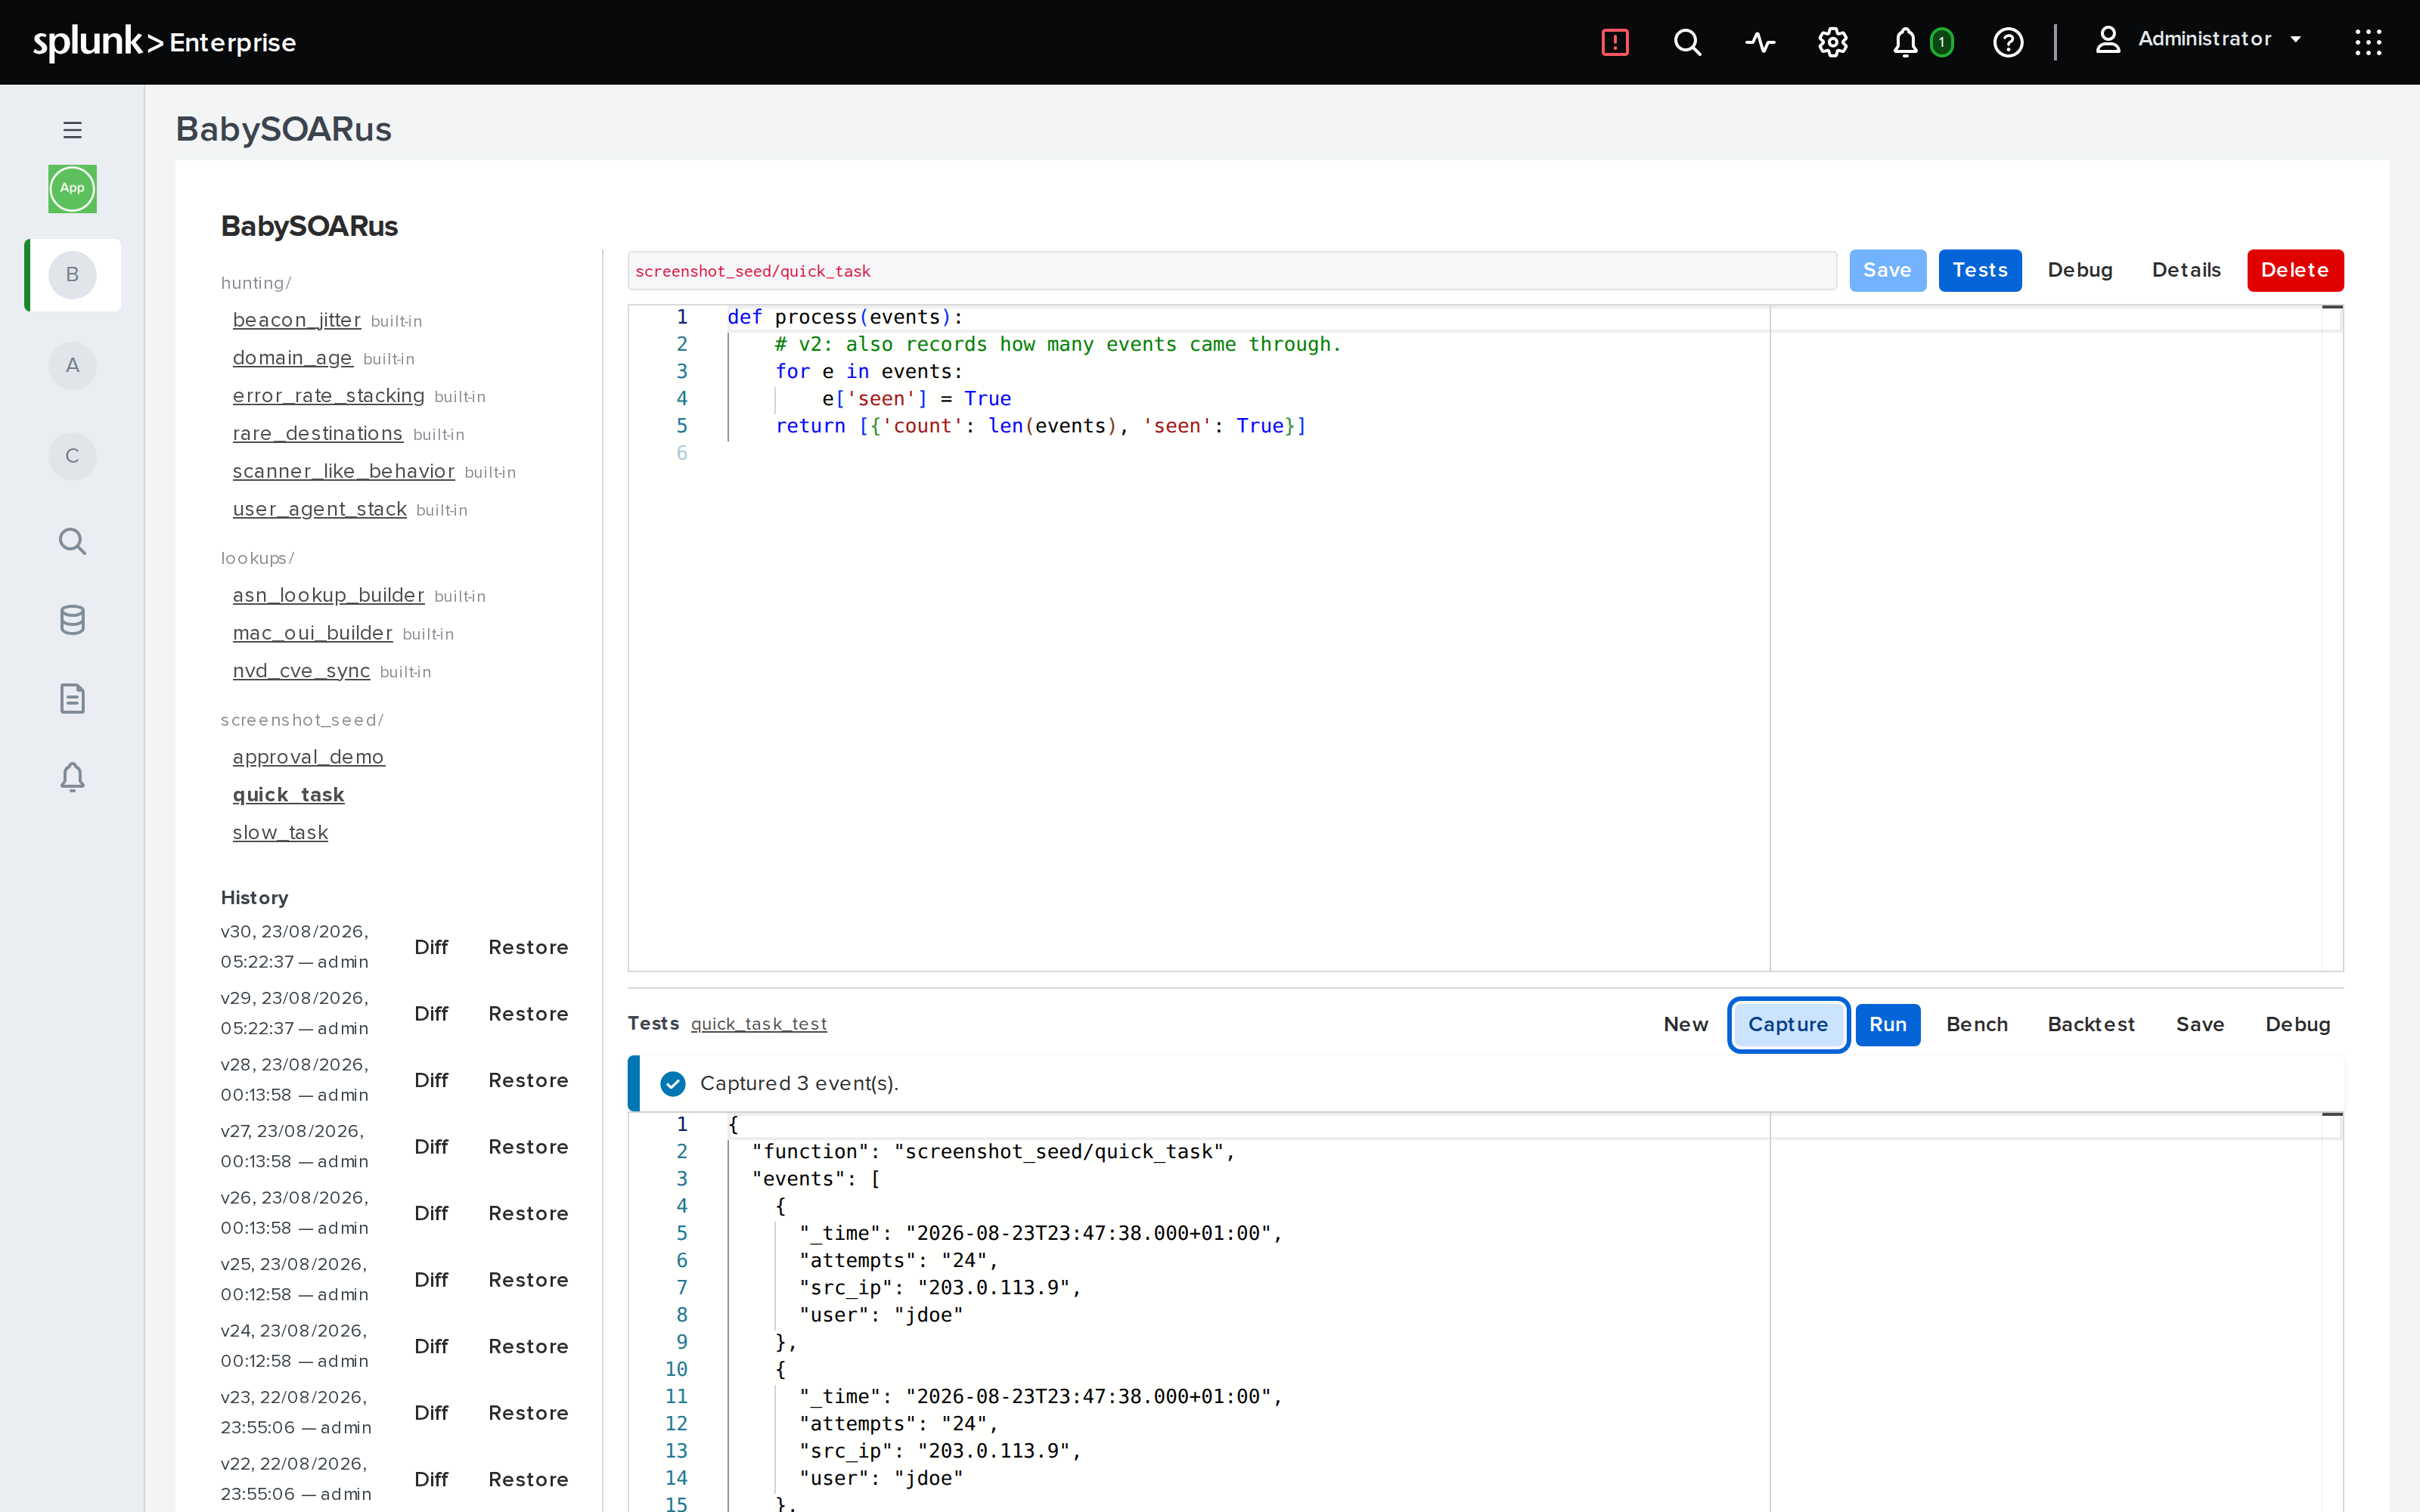
Capture fills events from a real search instead of asking somebody to type a
plausible-looking event by hand -- a fixture guessed at is a fixture that can quietly
stop matching what production actually sends. It runs whatever search is given, over
the last 24 hours, under the caller's own Splunk session (never a standing daemon
credential), and drops the results straight into events, verbatim: the same
string-valued shape a real search already hands a detection before the guest's own
casting runs, so a captured fixture behaves exactly like the real thing it came from.
A query that matches nothing says so rather than silently emptying the fixture.
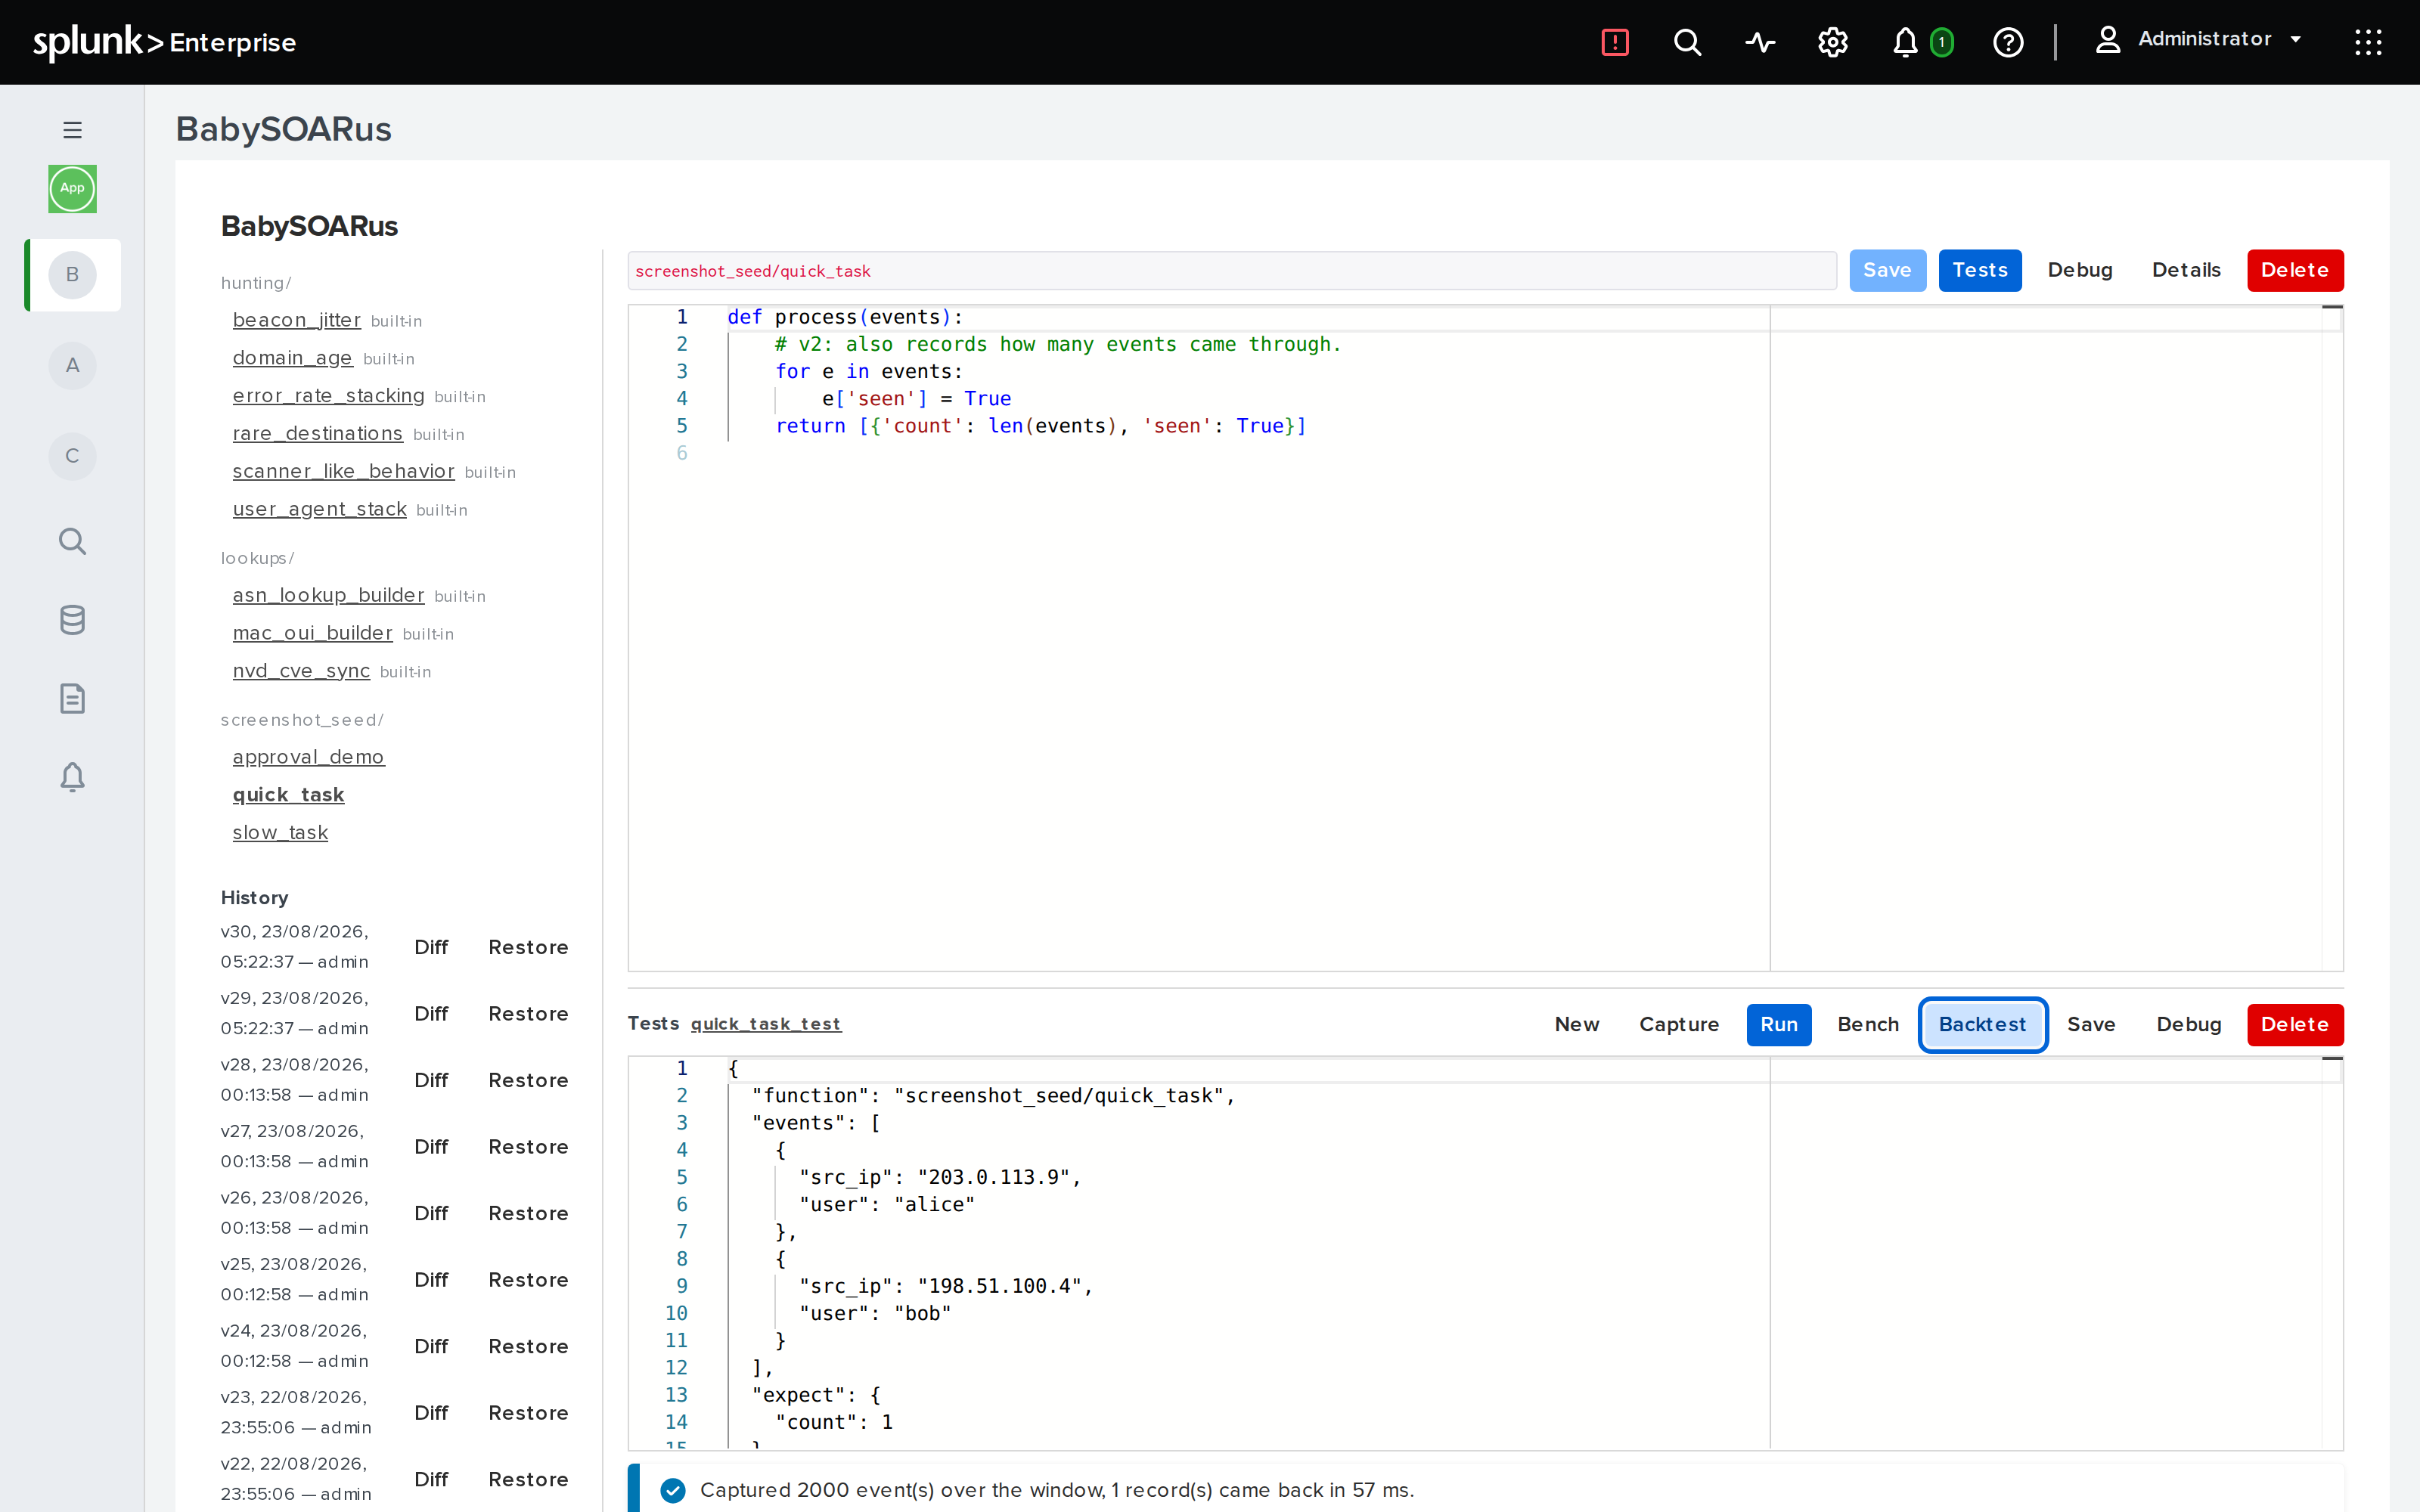
Backtest answers a different question from Run: not "does this pass a fixture", but "what would this detection actually have fired on". It runs the currently saved function -- never an unsaved edit -- against events captured from a real search over the last 24 hours, and reports how many events came in and how many records came back, which is how a threshold gets decided instead of guessed at. There is no pass or fail here, because there is nothing declared ahead of time to check against: a detection that errors against real historical data is still reported, in the same isolated, deny-egress sandbox Run and Bench already use, so a function that calls out over the network is refused rather than actually reaching a live system during a backtest.
Debug on a test jumps straight into the debugger below, carrying across whatever is currently in the Tests panel, saved or not.
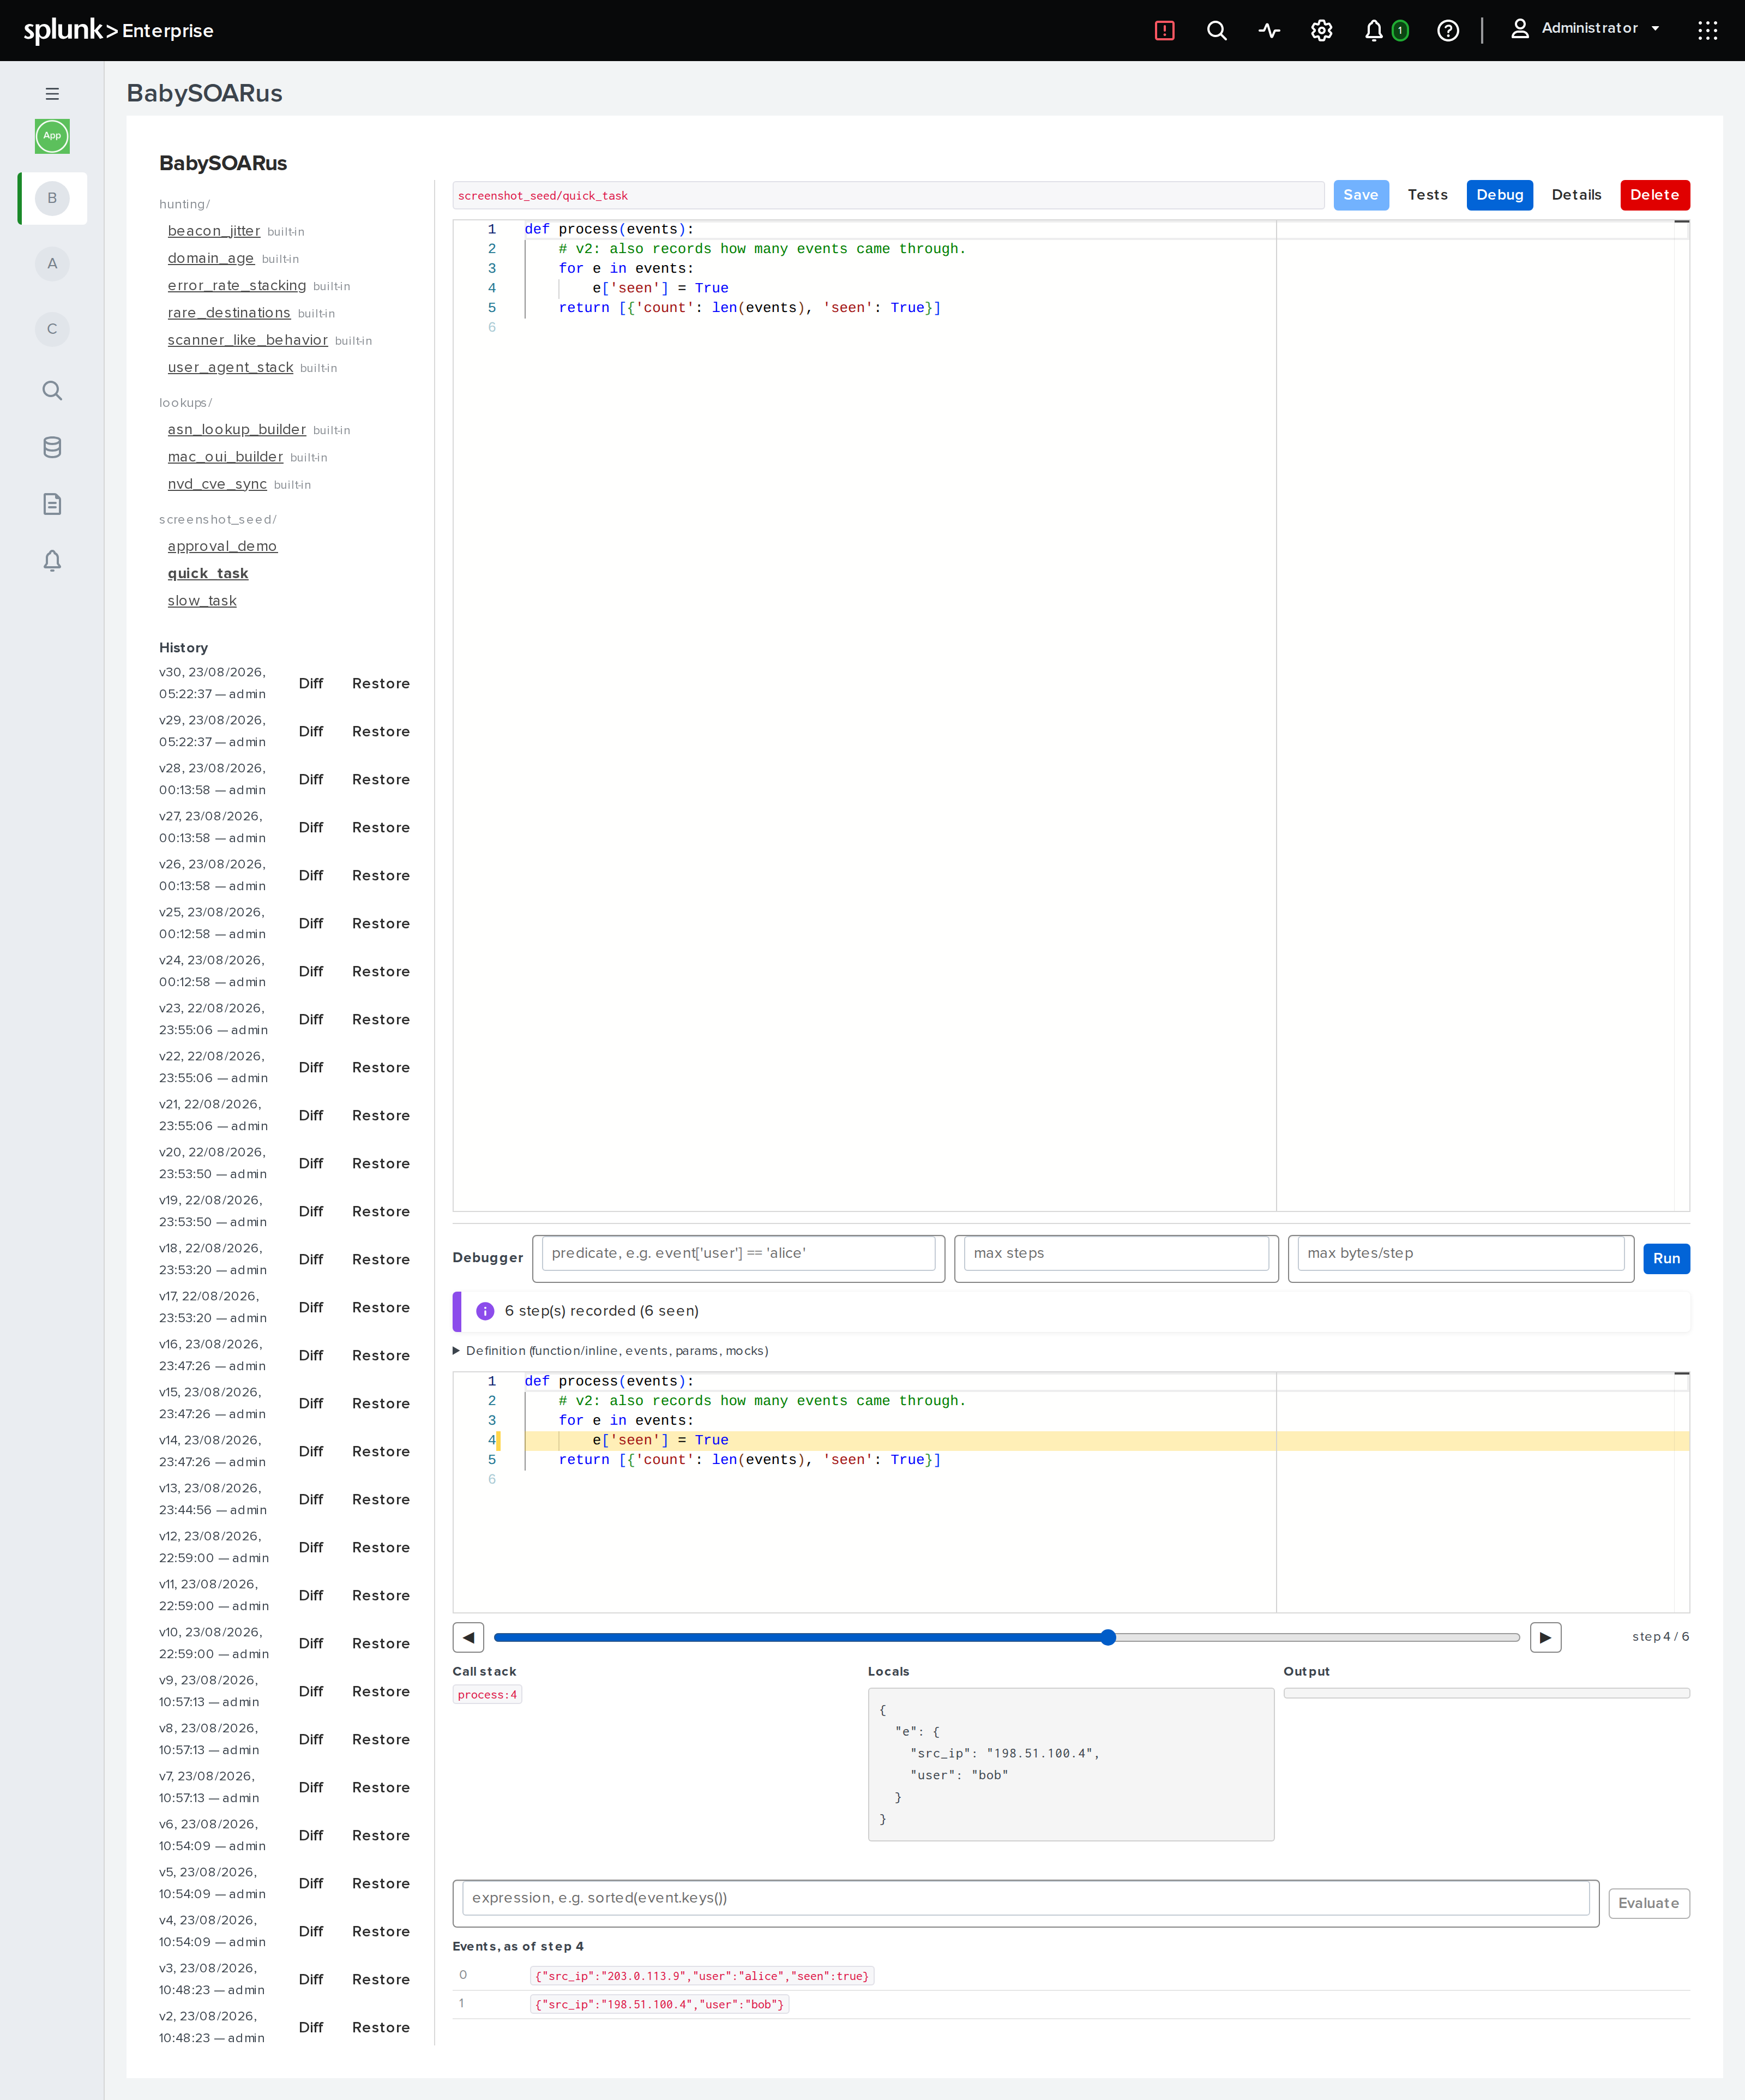
The Debugger
This is record-and-replay, not a live breakpoint: running a definition here
(debug.run) traces it once under sys.settrace and hands back a trace to scrub
through afterwards, rather than pausing execution while it happens.
The panel gives a slider over recorded steps, with prev/next, showing at each step: the call stack, local variables reconstructed from what changed since the last step, stdout/stderr interleaved up to that point, and the event batch as it stood -- click a record to jump to the first step that touched it. A traced exception gets its own Jump to exception button, with the full frame stack at the point it was raised.
Evaluate is a genuine re-run, not a lookup into the reconstructed Locals pane: it replays the trace up to the chosen step to rebuild a live namespace and evaluate an expression against it. If that replay diverges from the original recording, it says so and shows nothing, rather than risk presenting a wrong answer as a real one.
Metadata
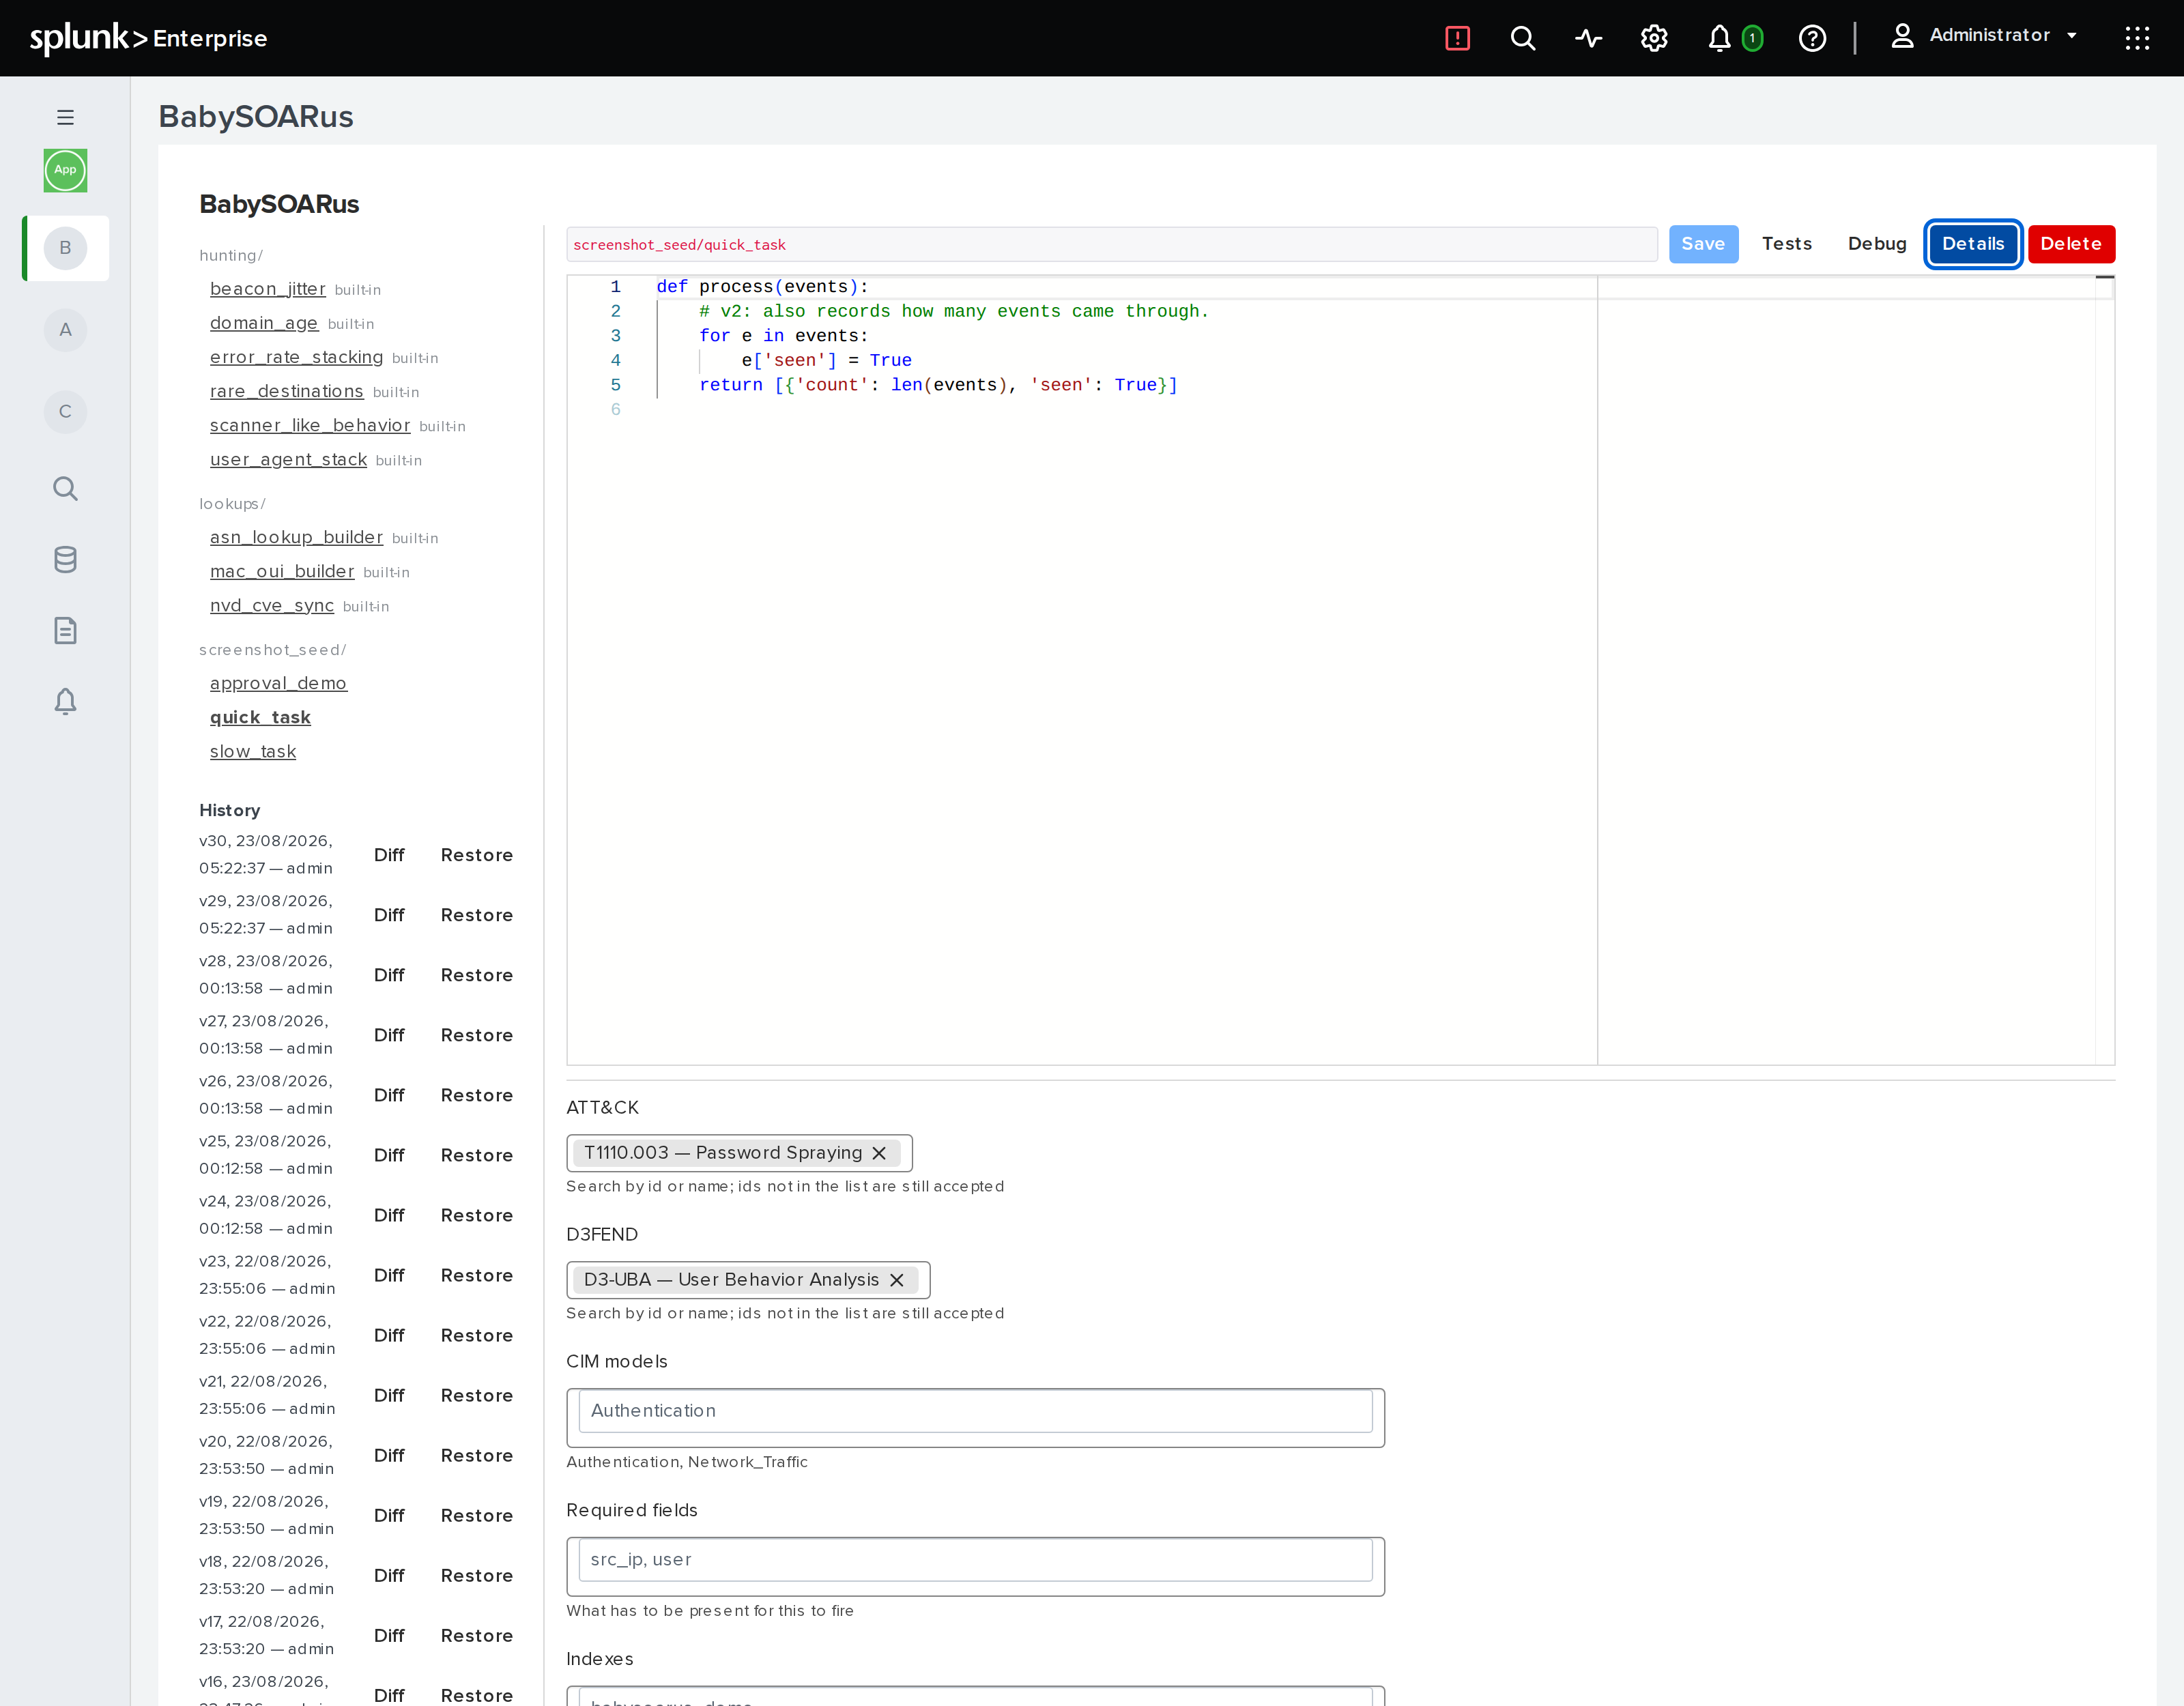
The Details panel is a structured form, not JSON, for the same fields the
built-in library's own meta.yaml carries: ATT&CK and D3FEND technique ids
(autocomplete against the real catalogue, freeform still accepted), CIM models,
required fields, indexes, severity, confidence, owner, references, and a
False positives field worth treating as more than an afterthought -- it is
what the next person who inherits this detection actually reads first.
Saving metadata re-fetches the current source before writing, so a Details save
can never clobber a code edit made in another tab, and creates a new version of
the whole function, the same as a code save does.
CIM Models Come from the Instance, Not a List
The CIM models field offers the data models this Splunk instance actually
has, read live from /services/datamodel/model rather than from a bundled
list of the standard CIM models.
That distinction matters more than it looks. A deployment without
Splunk_SA_CIM installed has none of the models a bundled list would offer, and
a picker confidently suggesting twenty-five names that resolve to nothing is
worse than one offering the two that are really there. As with ATT&CK and
D3FEND, a name that is not in the list is still accepted, so tagging a
detection for a model you have not installed yet works fine.
Each model reports whether it is accelerated, and each of its objects reports
the SPL that sources it, in both the | from datamodel: and | tstats forms.
Only the first works on an unaccelerated model; the tstats form against one
is valid SPL that quietly returns nothing, which is exactly the failure worth
being told about in advance rather than discovering in a search.
Coverage
The Coverage view, alongside the editor and Activity in Splunk Web's own navigation, is a report over every stored detection's Details panel, not a separate thing to maintain: which ATT&CK techniques and D3FEND countermeasures are covered, by which detections, and which detections carry no technique id at all. ATT&CK and D3FEND are independent reports, not merged into one -- an id in one framework says nothing about coverage in the other.
There is nothing to configure here. A technique appears the moment a Details panel records it and disappears the moment the last detection referencing it is edited to drop it; Refresh re-reads the current state rather than polling, since metadata changes on an edit, not moment to moment the way a running task does. Every detection listed links back to its own editor tab.
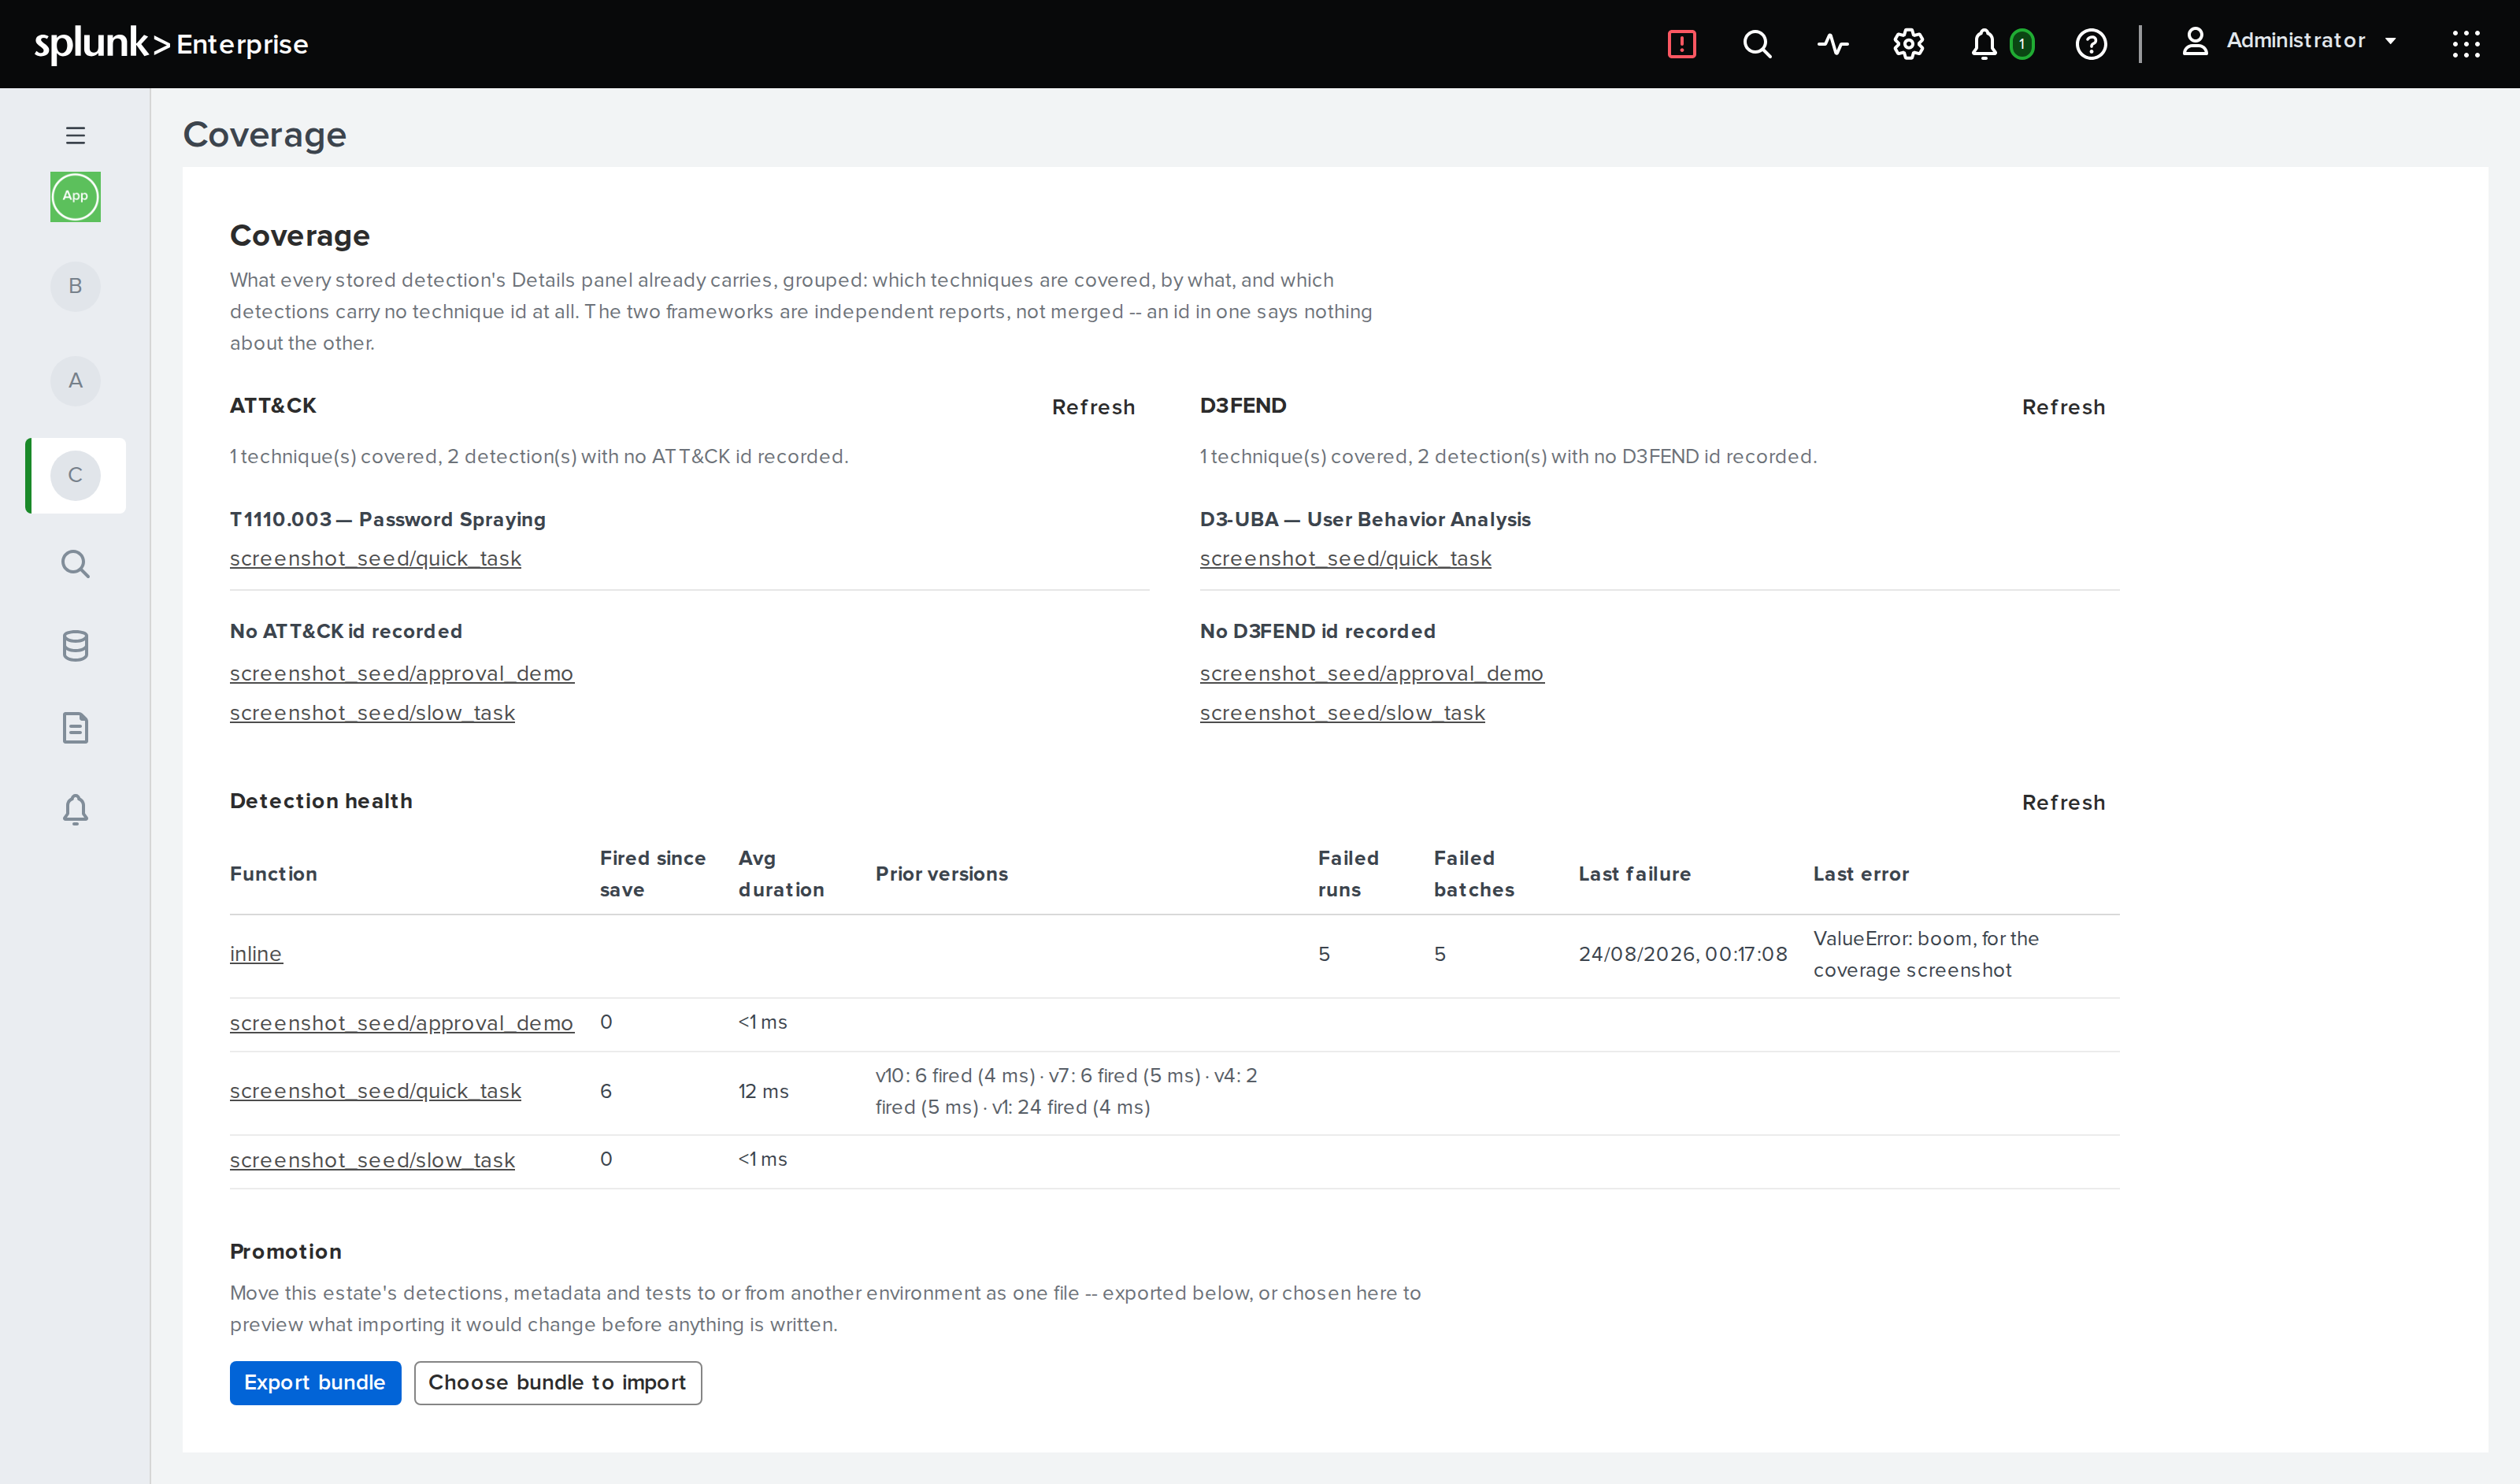
Only a customer's own detections show up here -- the built-in library ships its metadata as
meta.yaml on disk, not in the KV store this report reads, so a shipped detection is covered
by definition and does not need reporting on.
Detection health, below the two coverage panels, is a different question: not what a detection is supposed to detect, but whether it actually runs, and cleanly. Two independent counts, side by side. Fired since save and its average duration count every run -- success and failure both -- since the function's current version was saved, not since the dawn of time: an edit resets the window, which is what keeps this cheap to keep forever rather than something that eventually needs pruning. Resetting the current window does not throw the old one away, though: Prior versions lists what each superseded version's own fired count and average duration were, so a detection's rate before and after an edit is a comparison, not a number you had to have screenshotted yourself first. Failed runs and failed batches are the other half: any run that saw a guest-reported error or a host-level trap is recorded once for the whole run, not once per failing event, with the most recent message and whether the instance was trapped rather than merely reporting an error. A function with no failures listed has either never failed or never run at all -- this table answers "did it fail" and "how often does it run", not "is it running right now"; Running now and the Tasks panel answer that.
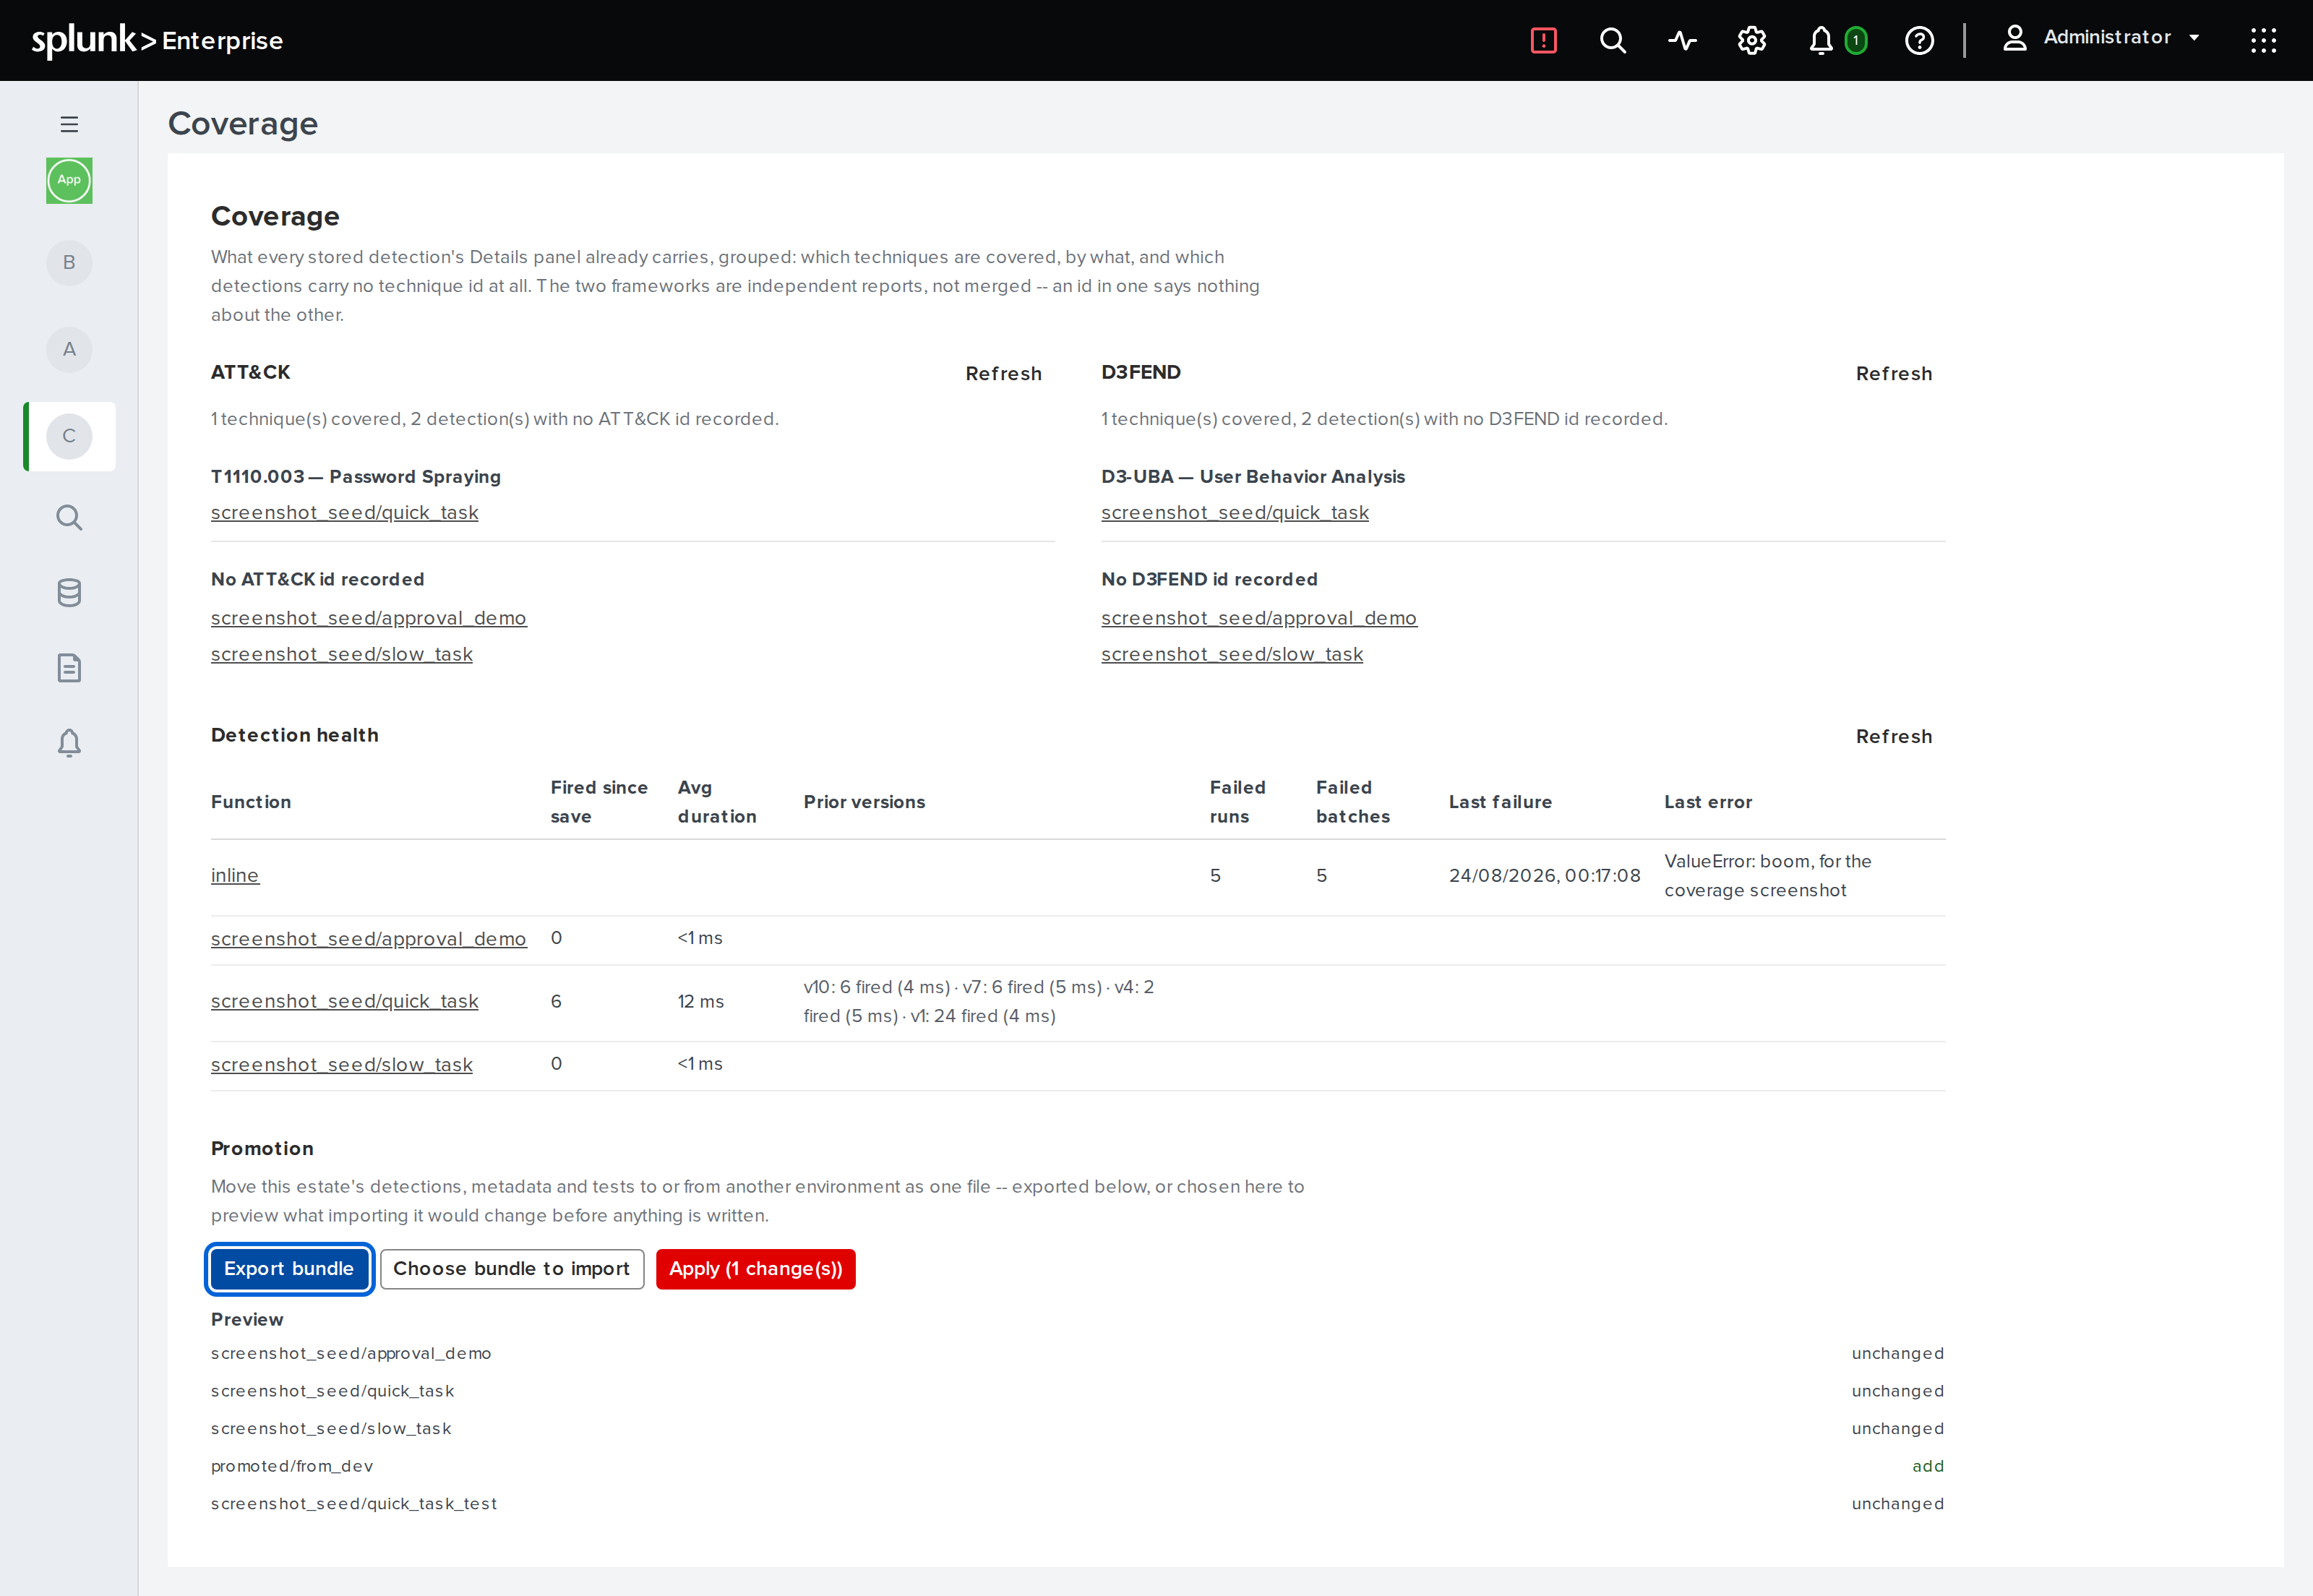
Promotion, below detection health, is what "detection as code" actually means: a detection authored on a development search head has to reach production somehow, and the only route without this is retyping it by hand. Export bundle downloads every stored detection, its metadata and every test that exercises one of them as a single JSON file. Choosing that file back on another environment previews what importing it would change -- add, update or unchanged, one line per detection and per test -- before anything is written; only the explicit Apply button actually writes, and applying the same bundle twice writes nothing the second time, since nothing has changed. There is no cryptographic signature on the file: integrity is content-addressed (every entry carries its own hash), not authenticated, and this page does not claim otherwise -- treat a bundle the way you would treat any other file somebody handed you, and know where it came from before importing it.
Reaching Every Search Head
A save writes to the daemon's KV store, not directly to any one host's disk -- that is what makes it durable and cluster-wide rather than tied to whichever search head happened to have the browser tab open. Distributed deployments covers how each member's own disk catches up from there.
Detection-as-code with babysoarus-ci
- Getting the Pieces
- Running One Thing
- Running a Test Suite
- Benchmarking, Honestly
- In a Pipeline
- Not Built Yet
Testing a detection normally needs nothing running: no Splunk, no daemon, no
network. babysoarus-ci loads the same runtime the editor's Tests
panel and the built-in
library both use, directly, as a single binary -- which is what makes running
your detections in a pull request practical instead of a project of its own.
Getting the Pieces
Two things, and they come from different places.
An installed app directory, for the Python executor and your own saved
functions. Any real install already has one -- point --app (or
BABYSOARUS_APP_DIR) at $SPLUNK_HOME/etc/apps/babysoarus, or at wherever
babysoarus.spl was extracted for a CI job that has no Splunk to install into at
all.
The babysoarus-ci binary itself, which ships in the same package, at
bin/babysoarus-ci. So both pieces come from the one babysoarus.spl you
already have: extract it, and the app directory and the binary are both
inside. A CI job needs no toolchain, no Splunk and no network -- one archive,
one extraction, done.
export BABYSOARUS_APP_DIR=/path/to/installed/BabySOARus
babysoarus-ci --version
Running One Thing
echo '[{"n": 5}]' > events.json
babysoarus-ci run --inline "for e in events:
    e['doubled'] = int(e['n']) * 2" --events events.json
--function NAME works the same way in place of --inline CODE, against a
saved function instead of a snippet typed on the command line. This is the
primitive everything else is built from, and on its own it is enough to
git bisect a detection that used to pass and does not any more.
Running a Test Suite
babysoarus-ci test tests/
Test definitions are exactly the test.json shape the
editor uses -- the same
file that runs in the browser runs here unchanged, because a test that only
exists in a KV store cannot be reviewed in a pull request:
{
  "name": "doubles the value",
  "inline": "for e in events:\n    e['doubled'] = int(e['n']) * 2",
  "events": [{ "n": 5 }],
  "expect": { "count": 1, "contains": [{ "n": 5, "doubled": 10 }] }
}
A path may be a single definition, an array of them in one file, or a directory -- walked recursively, entries sorted, so two identical runs report in the same order.
Exit codes are the whole API, and 1 and 2 mean different things on
purpose: 0 every test passed, 1 a test failed, 2 the tool could not
even run (a missing app directory, an unreadable file). A CI system that
cannot tell "your detection is broken" from "the runner is misconfigured"
shows both as the same red cross. --json prints machine-readable output
instead of the human-readable pass/fail list, for a job that wants to parse
the result rather than grep it.
A definition that cannot even start (a typo in function, malformed JSON) is
reported as that one test failing, not as the whole run aborting -- one bad
file never hides the results of every good one.
Benchmarking, Honestly
# Once, to record a baseline:
babysoarus-ci bench --function hunting/beacon_jitter --events events.json \
  --samples 30 --save baseline.json

# On every later run, to gate against it:
babysoarus-ci bench --function hunting/beacon_jitter --events events.json \
  --samples 30 --max-noise 10 --baseline baseline.json
Every figure is a median with its 10th and 90th percentiles, never a bare
number, and a null control -- the same function measured as both sides of a
comparison -- runs first, so the noise floor is on screen before any
figure that might be judged against it. --max-noise refuses to report at all
once that floor is too high to trust; --baseline then fails only once a
difference is larger than both runs' noise floors combined, not on any
slowdown at all, which is what keeps a regression gate usable on shared CI
hardware rather than disabled within a week for crying wolf.
In a Pipeline
- name: babysoarus-ci
  run: |
    babysoarus-ci test tests/
The whole point is that this step needs nothing else in the job: no Splunk service container, no network egress, no Python interpreter on the runner -- the one inside the WebAssembly component is the only one that ever runs your code, sandboxed exactly as it is in production.
Not Built Yet
babysoarus-ci fuzz and babysoarus-ci lint are named in the usage text and refused
outright rather than treated as typos -- the message says planned, not built
yet rather than unknown command.
Background Work, Notifications and Approvals
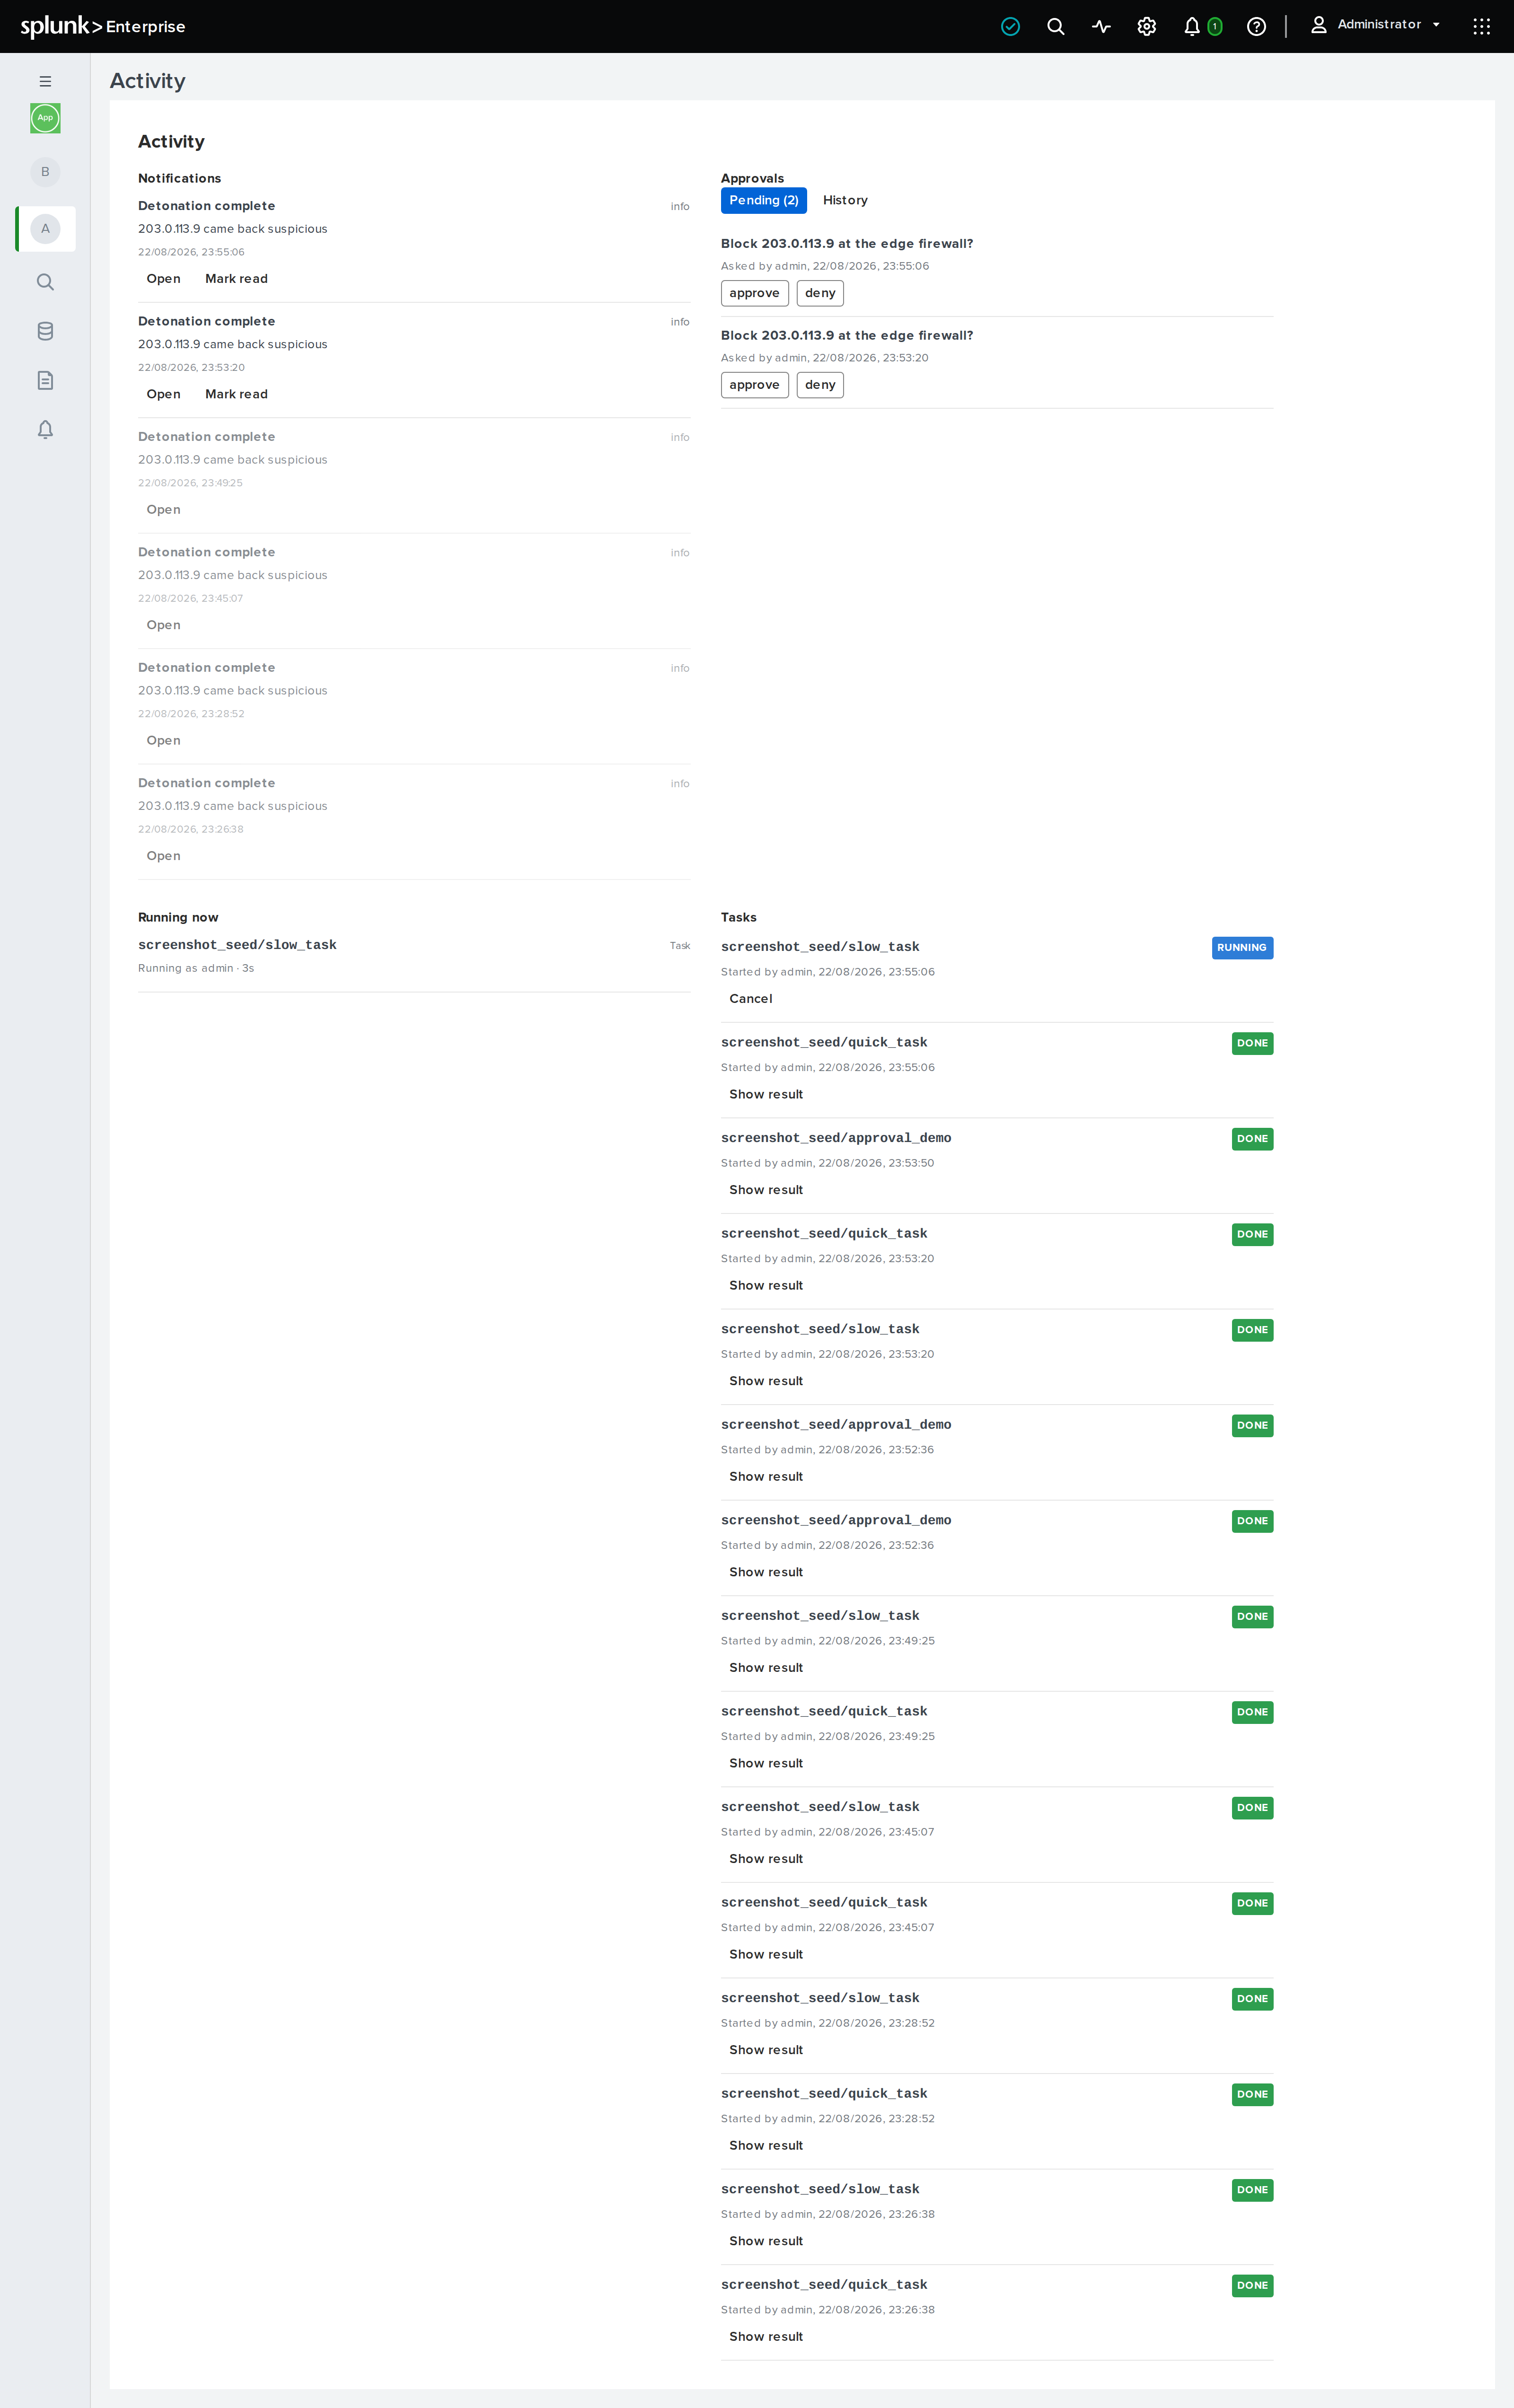
A search has a lifetime, and some things outlast it: a sandbox detonation that takes minutes, a question only a human can answer, a result someone should hear about without watching a dashboard for it. These three all work the same way -- start something, and come back to it later -- and all three show up in the same place: the Activity view, alongside the editor in Splunk Web's own navigation.
Background Tasks
task.start runs a saved function once, detached from the search that
started it, and returns immediately with an id:
from babysoarus_exec import task

def process(events):
    for e in events:
        if e.get('needs_detonation'):
            e['task_id'] = task.start('response/detonate_url', [{'url': e['url']}])
            e['status'] = 'detonation queued'
    return events
The function it names is an ordinary saved function -- def process(events),
the same shape as every other one, addressed the same way | exec function= addresses it. There is no separate "task function" shape to
learn; task.start's second argument plays the role a search's own batch
would, so it is a list of events, not an arbitrary object:
# functions/private/response/detonate_url.py
def process(events):
    for e in events:
        e['verdict'] = 'benign'  # a real sandbox call goes here
    return events
A later search (or another task) checks on it:
from babysoarus_exec import task

def process(events):
    for e in events:
        result = task.result(e['task_id'])
        e['task_status'] = result['status']  # queued, running, done, error, cancelled
        if result['status'] == 'done':
            e['verdict'] = result['result'][0]['verdict']
    return events
task.status(id) reports the same states without the result payload, for
polling that does not need it yet. task.cancel(id) asks a still-queued task
to stop -- best effort, and only while it has not already started.
Every task is also in the Tasks panel, in Activity:
who started it, what it ran, its current state, and its result or error once
it has one -- a real audit trail, not something you have to build yourself
out of task.status calls. It shows every task on this cluster member, not
just the ones you started, sorted newest first, with a Cancel button on
anything still queued or running.
What Is Running Right Now
Tasks are not the only thing Activity shows live. Running now lists
every invocation currently executing on this cluster member -- an ordinary
search's exec function= or exec inline=, not only a background task --
with who is running it and how long it has been going. It updates every few
seconds, and a run drops off the list the moment it finishes; there is
nothing to clean up and nothing kept once a run ends, since the Tasks
panel above is already where a background task's
history lives.
This is per cluster member, not cluster-wide: each daemon reports only what its own process is executing right now, the same limit background tasks already have on where a task actually runs.
Notifications
notify tells a specific person something, without them needing to be
watching a search:
from babysoarus_exec import notify

notify('soc-lead', 'warn', 'Detonation complete',
       f'{url} came back {verdict}', deep_link='response/detonate_url')
severity is critical, error, warn, info or debug. deep_link is
an app-relative path -- typically a function name -- that Activity's
Open button navigates to. A notification addresses one username, not a
role: point it at a person, or a small distribution of calls at several.
Approval Gates
prompt.ask is the third mechanism in this family -- asking a human a
yes/no (or multiple-choice) question without blocking the search that asks
-- covered in full, with a worked containment example, in Response
plans.
The Activity View
Notifications, pending approvals, what is running right now, and the task manager all live on their own page, Activity, in Splunk Web's own navigation next to the editor -- not tucked into whichever function happens to be open, since none of the four are about that. It polls rather than pushes (Splunk offers an app no server-push channel), so a new notification, approval request or task update shows up within moments, not the next time someone happens to reload. Running now polls faster than the rest, since it exists to feel close to real-time.
Notifications list newest first, read ones fading rather than disappearing -- the list is its own history, with nothing separate to check for what already happened. Approvals show what is waiting on you, who asked and when, with a button per option; once answered, a prompt moves from Pending to a History tab that persists across every prompt you have ever answered, not just the most recent one. Running now is the live view described above. Tasks is the audit trail described above -- every task on this cluster member, its owner, its state, and its result on demand.
Configuration
- Command Arguments
- Daemon Settings
- Command Registration
- Alert Action
- Suppressing the Risky-command Warning
- Where State Lives
- Dependencies
Nearly everything has a sensible default. This page is what to change when it does not.
Command Arguments
| Argument | Default | Meaning |
|---|---|---|
inline=<python> | Source to run for each micro-batch. | |
function=<name> | A .wasm component in functions/. The suffix is optional. | |
batch_size=<n> | 32 | Events per guest call. |
autocast=<mode> | false | Infer field types: true, false or strict. |
inline and function are mutually exclusive, and one is required.
batch_size trades latency against throughput. Lower shows results sooner;
higher amortises per-batch work over more events. Raise it when your snippet
does expensive setup, lower it when an analyst is waiting.
index=web | exec inline="..." batch_size=512
Daemon Settings
Read from the daemon's environment when it starts. Because clients start it
lazily, the cleanest way to set them is in $SPLUNK_HOME/etc/splunk-launch.conf
so splunkd's environment carries them.
| Variable | Default | Purpose |
|---|---|---|
BABYSOARUS_LOG | info | Log filter: error, warn, info, debug, trace. |
BABYSOARUS_POOL_SIZE | 16 | Warm instances kept per function. |
BABYSOARUS_POOL_IDLE_SECS | 300 | Idle seconds before a warm instance is dropped. |
BABYSOARUS_TIMEOUT_EXECUTE_SECS | 30 | Execution budget per micro-batch. |
BABYSOARUS_TIMEOUT_BEGIN_RUN_SECS | 60 | Budget for run setup. |
BABYSOARUS_TIMEOUT_END_RUN_SECS | 10 | Budget for run teardown. |
BABYSOARUS_STRICT_SPLUNK_TLS | unset | Require a trusted certificate on Splunk's management port. |
BABYSOARUS_CA_BUNDLE | unset | Extra PEM bundle to trust when fetching packages. See Dependencies. |
BABYSOARUS_APP_DIR | derived | Override app-root detection. |
After changing any of them, restart the daemon so it picks them up:
pkill -f etc/apps/babysoarus/bin/babysoarus-daemon
The next search starts a new one.
Pool Sizing
Each warm instance holds a booted interpreter, so the pool trades memory for latency. The default of 16 per function suits a search head serving a team.
Raise it if many searches run concurrently and the daemon log shows frequent
instantiated cold instance at debug. Lower it on a memory-constrained
host. A cold instance is more expensive than a warm one but still small in
absolute terms, and is rarely the thing worth optimising.
Timeouts
The execution budget is enforced by interrupting the guest, not by killing a process, so it is precise and cheap. A snippet that exceeds it fails that batch with a clear message.
Raise BABYSOARUS_TIMEOUT_EXECUTE_SECS if you make slow API calls from inside a
snippet. Remember it applies per batch of 32 events, not per search.
Command Registration
default/commands.conf registers both search commands:
[exec]
filename = babysoarus-cmd
chunked = true
command.arg.1 = --mode
command.arg.2 = streaming
is_risky = true
run_in_preview = false
With chunked = true, Splunk honours only is_risky, maxwait,
maxchunksize, filename, command.arg.<N>, python.version and
run_in_preview. Everything else is negotiated in the protocol at run time.
Settings worth knowing about:
is_risky = true makes Splunk Web warn before running a search loaded
from a link or URL. Keep it. The command runs arbitrary code.
run_in_preview = false stops the command running while a search is only
generating previews. Since guest code can make outbound calls, doing the work
twice would be wrong.
local = true, if you add it, forces the command onto the search head
instead of letting Splunk distribute it to indexers.
To override any of these, put your changes in
$SPLUNK_HOME/etc/apps/babysoarus/local/commands.conf rather than editing
default/.
Alert Action
default/alert_actions.conf registers execalert:
[execalert]
is_custom = 1
label = Execute WASM/Python
payload_format = json
alert.execute.cmd = babysoarus-alert
alert.execute.cmd.arg.0 = --execute
max_results = 1000000000

param.inline =
param.function =
param.autocast =
max_results is the cap on rows handed to the action. Lower it if you would
rather an alert processed a bounded sample than everything.
Suppressing the Risky-command Warning
Splunk warns whenever a search containing a risky command is loaded from a
URL. On a shared search head that becomes noise, and administrators often turn
it off globally in web.conf:
[settings]
enable_risky_command_check = false
Think about it before you do. The warning exists because commands like exec
can run arbitrary code, and a link that silently runs a search is a real
phishing vector. Restricting who may run the command with Splunk capabilities
is a better answer than removing the warning for everyone.
Where State Lives
$SPLUNK_HOME/etc/apps/babysoarus/
  config/
    acl.json         network policy for guest egress, optional
    packages.json    Python packages to install, optional
  packages/
    installed.json   what the daemon believes it installed
    <modules>        unpacked wheels, read-only to guest code
  var/
    daemon.sock   mode 0600, owner only
    daemon.lock   single-instance lock
    daemon.log
    cache/        Wasmtime compiled-code cache
    cwasm/        precompiled components, named by content hash
    pycache/      bytecode for installed packages
The two files under config/ have their own chapters, because each is more
than a key list: acl.json in Security model
and packages.json in Dependencies.
Everything under var/ is regenerable. Deleting it costs one recompilation.
packages/ is regenerable too, as long as config/packages.json still
describes what should be there: the daemon rebuilds it on the next start.
Dependencies
Adding third-party Python packages to the interpreter has its own page: Dependencies.
Dependencies
- Installing a Package on a Running Deployment
- Adding a Package at Build Time
- What the Build Actually Does
- Doing It by Hand
- What Will Not Work
- Packages Worth Vendoring
- Costs
- Keeping It Reproducible
Inline snippets can use third-party Python packages. There are two ways to get one, and they differ in when the work happens rather than in what you end up with:
| Question | Installed at run time | Vendored at build time |
|---|---|---|
| You edit | config/packages.json on the search head | requirements.txt in the source tree |
| Takes effect | next daemon start, no rebuild | after make python precompile and a reinstall |
| Needs | network access from the search head to an index | a build machine |
| Best for | adding a package to a deployment you have already shipped | packages every deployment should have |
Pure Python only, either way. A package that ships a compiled extension module is built for a physical CPU, and the sandbox is WebAssembly. Both paths detect this and refuse, rather than producing something that fails at search time. See What will not work.
Installing a Package on a Running Deployment
Write config/packages.json inside the app directory:
{
  "packages": [
    { "name": "jmespath", "version": "1.0.1" },
    { "name": "python-dateutil", "version": "2.9.0.post0" }
  ]
}
The daemon reads it at startup, downloads each wheel, checks its SHA-256
against what the index published, unpacks it into packages/, and records what
it did in packages/installed.json. Restart the daemon and the package is
importable:
pkill -f etc/apps/babysoarus/bin/babysoarus-daemon
There is no need to restart Splunk: the next search starts the daemon again,
and it finishes reconciling before it accepts a connection, so the first search
after the restart already sees the package. Watch it happen in
$SPLUNK_HOME/etc/apps/babysoarus/var/daemon.log:
INFO installed Python package package=jmespath version=1.0.1 files=8
INFO reconciled Python packages installed=1 removed=0 unchanged=0 failed=0
INFO precompiled Python bytecode compiled=8 failed=0 elapsed_ms=41
That last line is the daemon compiling the package's bytecode straight away,
so the first search does not have to. The result is cached in var/pycache/,
is regenerable, and is removed along with the package if you withdraw it.
A package that cannot be installed is logged as an error and the daemon still starts. That is deliberate: one bad entry should cost you that package, not every search on the search head.
The file is declarative: the daemon makes packages/ match it. Removing an
entry uninstalls it, changing a version replaces it, and running with the same
file twice does nothing the second time. Only files the manifest records are
ever deleted, so anything you place in packages/ by hand survives.
No file and an empty file mean different things.
{"packages": []}means "manage this, and it should be empty", so it uninstalls everything. Deletingconfig/packages.jsonaltogether means "do not manage this", and leaves what is already installed alone. If you want the packages gone, empty the list rather than deleting the file.
Versions Are Exact, on Purpose
"version": "1.0.1" is required. Ranges such as >=1.0 are refused, because
two search heads reconciling a week apart would then install different code
from the same configuration. If you want to be stricter still, pin the wheel
itself:
{ "name": "jmespath", "version": "1.0.1", "sha256": "02e2e4cc71b5bcd8..." }
Then the index must offer that exact wheel, or nothing is installed.
Using an Internal Index
Most enterprise search heads cannot reach pypi.org. Point at a mirror:
{
  "index_url": "https://pypi.internal.example.com",
  "packages": [{ "name": "jmespath", "version": "1.0.1" }]
}
The URL must speak the PyPI JSON API, which is what Artifactory, Nexus and
devpi all provide: the daemon reads <index_url>/pypi/<name>/<version>/json.
If the mirror presents a certificate signed by your own CA, point the daemon at the bundle:
export BABYSOARUS_CA_BUNDLE=/etc/pki/tls/certs/corporate-ca.pem
The daemon trusts the public roots and the system trust store already; this adds to them. It is validated when read, so a path that does not exist, or a file with no certificates in it, is an error at startup rather than a confusing TLS failure later.
Why not
SSL_CERT_FILE? Splunk sets that variable in every process it starts, and points it at its own trust store. On some versions it points at a file that is not shipped at all. BabySOARus therefore ignores it and usesBABYSOARUS_CA_BUNDLEinstead, so that what the daemon trusts is something you chose rather than something you inherited.
The Network Policy Applies to Installs Too
If config/acl.json is present and enforcing, the index
host must be permitted by it. The daemon will not fetch from a host you have
denied to guest code, and says so rather than failing quietly:
the network policy does not permit pypi.org, so packages cannot be installed
from https://pypi.org. Add it to allow_hosts in config/acl.json, or point
index_url at a mirror that is permitted
With no policy file at all, egress is unrestricted and so is the installer.
Turning Installation Off without Deleting the File
{
  "enabled": false,
  "packages": [{ "name": "jmespath", "version": "1.0.1" }]
}
enabled defaults to true, so omitting it installs. Setting it to false
stops the daemon reconciling from the file while leaving the list intact, which
is what you want when isolating whether a package is behind a problem. It does
not uninstall anything already in packages/; removing an entry does that.
What Guest Code Sees
packages/ is preopened read-only at /packages and appended to
sys.path. Read-only is deliberate: code that could write there could replace
the module the next search imports. Bytecode goes to a separate writable
directory instead, so importing a package does not recompile it every run.
Because /packages is appended rather than prepended, an installed package can
never shadow the standard library or a build-time vendored package. A package
named json will not change what json means in an existing snippet.
Adding a Package at Build Time
Add it to python/exec_component/requirements.txt:
python-dateutil==2.9.0.post0
jmespath==1.0.1
Then rebuild:
make python precompile
SPLUNK_HOME=/opt/splunk make install
That is it. The package is now importable:
| makeresults
| eval doc="{\"a\": {\"b\": [10, 20, 30]}}"
| exec inline="import jmespath
for e in events:
    e['picked'] = jmespath.search('a.b[1]', json.loads(e['doc']))"
           _time                       doc             picked
--------------------------- -------------------------- ------
2026-07-31 21:34:51.000 BST {"a": {"b": [10, 20, 30]}}     20
Vendored packages are also in scope without importing them, so
jmespath.search(...) works directly.
What the Build Actually Does
make python runs python/vendor-deps.py, which:
- installs your requirements with
pip install --target python/exec_component/vendor, falling back touv pip install --targetif pip is not on the path; - scans the result for compiled extension modules and stops if it finds any;
- writes
python/exec_component/_vendored.py, a generated module containing oneimportline per vendored package; - passes
-p . -p vendortocomponentize-pyso both directories are on the interpreter's path.
Step 3 is the one that matters. componentize-py resolves imports when the
component is built and snapshots the interpreter's memory, so a package
that merely exists on disk is not importable at search time. The generated
module forces every vendored package to be imported during the build, which
puts it in the snapshot.
# python/exec_component/_vendored.py, generated
import jmespath

VENDORED = {
    "jmespath": jmespath,
}
You never edit that file. It is regenerated from requirements.txt.
Doing It by Hand
If you would rather drive the install yourself:
pip install --target python/exec_component/vendor jmespath==1.0.1
python3 python/vendor-deps.py     # regenerates _vendored.py from what is there
make python precompile
vendor-deps.py reinstalls from requirements.txt when run on its own, so
keep the file in step with what you want vendored.
What Will Not Work
Anything with a .so, .pyd or .dylib in it. The build says so plainly:
these vendored files are compiled for a native CPU and cannot run inside
WebAssembly:
  orjson/orjson.cpython-312-x86_64-linux-gnu.so

Only pure-Python packages can be vendored. Look for a pure-Python alternative,
or move the work to the host side of a custom .wasm function. Pass
--allow-native to install anyway.
The usual suspects, and what to do instead:
| Package | Why not | Instead |
|---|---|---|
numpy, pandas, scipy | Compiled | statistics, or a Rust custom function |
requests, httpx | Need real sockets | http_request, which the host performs |
cryptography, pyOpenSSL | Compiled | hashlib, hmac, secrets |
orjson, ujson | Compiled | json, already present |
lxml | Compiled | xml.etree.ElementTree, already present |
psycopg, pymysql | Need sockets | Query via an HTTP API, or a custom function |
regex | Compiled | re, already present |
A useful test before you try: if the wheel on PyPI is named
something-1.2.3-py3-none-any.whl, it is pure Python and will work. If it is
named something-1.2.3-cp314-cp314-manylinux_x86_64.whl, it will not: a
cp tag means compiled code, whichever version follows it.
Packages Worth Vendoring
These are pure Python, small, and genuinely useful in a SOC context:
| Package | For |
|---|---|
python-dateutil | Parsing the timestamp formats datetime refuses |
jmespath | Querying deeply nested JSON without ten .get() calls |
tldextract | Correct public-suffix handling for domains |
pyparsing | Grammar-based parsing of odd log formats |
cbor2 | CBOR payloads |
chardet | Character-set detection on messy fields |
stix2-patterns | Validating STIX patterns from a feed |
Costs
Every vendored package increases the component image, its build time, and the memory each pooled instance maps. The interpreter image is about 33 MB before any dependencies. A handful of small pure-Python packages adds a megabyte or two and is not worth worrying about; vendoring something enormous is.
Because the image is mapped copy-on-write into each pooled instance, size costs address space rather than per-search CPU. It does not slow searches down. It does make the build take longer.
Keeping It Reproducible
Pin exact versions in requirements.txt. The vendor directory is generated
and should not be committed, but requirements.txt and the generated
_vendored.py describe exactly what a build will contain, so both belong in
version control if you want reproducible interpreters across a fleet.
Operations
What runs, where it lives, and how to tell what it is doing.
The Daemon
One babysoarus-daemon process per host, holding the WebAssembly engine and the
pool of warm interpreters.
It is not managed by Splunk. The first search that needs it starts it, and it stays running afterwards. That is the entire performance argument: the expensive setup happens once rather than once per search.
# Is it running?
pgrep -af etc/apps/babysoarus/bin/babysoarus-daemon

# What is it doing?
tail -f $SPLUNK_HOME/etc/apps/babysoarus/var/daemon.log

# Restart it, waiting for searches already in flight to finish first
bin/stop-daemon.sh "$SPLUNK_HOME/etc/apps/babysoarus/bin/babysoarus-daemon"
Stopping it is graceful, not merely safe: a search already using it keeps running to
completion (up to a five-minute grace period, BABYSOARUS_SHUTDOWN_GRACE_SECS to change that)
rather than failing, and a new search started while the old one is draining gets a fresh
daemon automatically, because the socket is unlinked the moment the stop signal arrives.
Verified live: a ten-event search sleeping two seconds per event survived a stop issued
partway through, finishing normally rather than erroring (execution log, 2026-08-22).
bin/stop-daemon.sh sends the signal and then genuinely waits for the process to be gone,
which a bare pkill does not -- it returns immediately, before the daemon (which may now be
draining real work) has actually exited.
Only one daemon can run per app directory. It takes an exclusive lock on
var/daemon.lock before binding its socket, so two searches starting at the
same instant cannot produce two daemons: the loser exits quietly and its
client connects to the winner.
Reading the Log
At info the daemon is quiet. A healthy start looks like:
INFO mounted Splunk lookup directories count=6
INFO engine ready app_dir=/opt/splunk/etc/apps/babysoarus allocation=Pooling
INFO loaded precompiled Python executor path=.../wasm/exec.cwasm
INFO compiled component hash="35b654f1..." elapsed_ms=56
INFO loaded function function=example path=.../functions/public/example.wasm
INFO scanned functions directories functions=1
INFO watching functions directory dir=.../functions/public
INFO listening socket=.../var/daemon.sock startup_ms=121
Two lines are worth checking.
allocation=Pooling means the pooling allocator is in use. If it says
OnDemand, the host would not let it reserve address space and instantiation
will be slower. Usually a container memory limit or a low vm.max_map_count.
loaded precompiled Python executor means the shipped .cwasm was
usable. If instead you see precompiled Python executor is incompatible; falling back to compiling exec.wasm, the artefact was built by a different
Wasmtime version and every daemon start pays a few seconds of compilation.
Rebuild with make precompile.
Turn up detail with BABYSOARUS_LOG=debug, which adds one line per instantiation
and per pool hit.
Upgrading
make app
SPLUNK_HOME=/opt/splunk make install
$SPLUNK_HOME/bin/splunk restart
make install kills the running daemon before replacing binaries, so the old
one cannot keep serving old code. Splunk itself only needs restarting when
configuration files change.
Capacity
Sizing follows from three properties rather than from a throughput number:
- Per-search overhead is small and fixed. A warm search pays microseconds of daemon time before your logic runs, so it does not grow with your data.
- Throughput is dominated by your snippet, not by the sandbox boundary. Measure the searches you actually run; a benchmark of an empty loop tells you about the loop.
- Memory scales with pool size, not with search volume, because a pooled instance holds a booted interpreter and is reused.
Concurrent searches run genuinely in parallel across cores, so the daemon is rarely the bottleneck. Measure on your own hardware before sizing; the performance chapter explains how, and how much the figures move between runs. Where the daemon can be the bottleneck:
Too few warm instances. BABYSOARUS_POOL_SIZE defaults to 16 per function. If
debug logging shows constant instantiated cold instance, raise it.
Long-running guest calls. A snippet making a slow HTTP call holds its instance for the duration. That is correct, but many such searches at once will exhaust the pool. Batch the calls.
Memory. Each instance maps the interpreter image copy-on-write, so the
marginal cost per instance is much smaller than the 33 MB image suggests.
Lower BABYSOARUS_POOL_SIZE and BABYSOARUS_POOL_IDLE_SECS on constrained hosts.
Distributed Deployments
Deploy the app everywhere the command will run. Each host runs its own daemon and its own pool; nothing is shared between hosts and there is no coordination.
exec reports itself as distributable, so Splunk may run it on indexers.
execgen always runs on the search head, as generating commands do. If you
would rather exec always ran on the search head too, add local = true to
the [exec] stanza in commands.conf.
Guest state that accumulates within a search, such as the seen set in the
first-seen example, is per host. Under distributed search each indexer
sees only its own share. When that matters, do the aggregation in SPL with
stats and run the snippet after it, on the search head.
Saved Functions Reach Every Host on Their Own
Unlike guest state, a function you save in the editor is not per host. Saving writes to the daemon's KV store, which every member of a search head cluster already shares, then reaches each member's own disk the next time a search actually lands there.
That last step is driven by real search traffic, not a timer: the daemon holds no standing Splunk credentials, so a background poller checking the KV store at 3am would need to invent some. Instead, every search that arrives already carries the searching user's own session token, which is exactly the credential a KV store read needs, at exactly the moment the answer matters. A member with no traffic never syncs, and that costs nothing, since nothing on that host is asking to run the function yet.
In practice this means a save reaches every host with searches actually running against it within a couple of seconds, and a host that has been idle picks it up on its very next search rather than on some fixed interval. A slow or unreachable KV store degrades to stale, not stuck: reconciling has a five-second budget, and a run proceeds with whatever is already on disk once that budget runs out rather than hang the search waiting for it.
Backup
There is nothing to back up. var/ is a cache, and everything else came from
the build. Include functions/public/ in whatever manages your app content,
the same as any other app file.
Monitoring
The daemon exposes no metrics endpoint. What you can watch:
index=_internal source=*splunkd.log* component=ChunkedExternProcessor BabySOARus
Search-level timing is in the job inspector under command.exec, which counts
the time the command spent including the daemon round trip.
For the daemon itself, the log is the interface. BABYSOARUS_LOG=info reports
loads, reloads, evictions and connection errors, which is generally what you
want to alert on.
Licensing
- The Trial: 90 Days, Everything, No Signup
- What Expiry Does, and Does Not Do
- Buying a Licence
- Installing a Licence
- Enforcement Modes
- What Is Licensed
- Editions
- Frequently Hit Problems
BabySOARus is commercial software. This page is what an administrator needs: what happens with no licence, how to install one, and what expiry actually does.
The agreement itself is the LICENSE file that ships with the app, in
$SPLUNK_HOME/etc/apps/babysoarus/LICENSE.
The Trial: 90 Days, Everything, No Signup
A fresh install runs at full capability for 90 days. Not a reduced edition, not a feature-gated preview: the whole product, including every library detection, the editor, background work, and outbound network access.
You do not sign up, request a key, or give us an email address. The clock starts the first time the daemon observes the install and is tracked locally, in your own KV store. Nothing contacts us.
To see where you stand, open the Licence page in the app's own navigation, alongside the editor, Activity and Coverage. It shows the edition, the state, whether anything is currently being restricted, the enforcement mode, and how many days of the trial are left.
You will also be told without going looking. A banner appears on every page of the app once the trial has fourteen days or fewer to run, and again if the install is ever actually being degraded. It says nothing at all the rest of the time, which is the point: a warning that is always on screen is not read on the day it matters.
The same answer over REST, for scripting and monitoring:
curl -sk -u admin:PASSWORD https://localhost:8089/services/babysoarus \
  -H 'Content-Type: application/json' \
  -d '{"method":"licence.status"}'
{
  "found": false,
  "enforcement_mode": "trial",
  "trial_started_at": "2026-08-26T13:15:08Z",
  "trial_expires_at": "2026-11-24T13:15:08Z",
  "trial_days_remaining": 90,
  "edition": "trial",
  "degraded": false
}
found: false means no licence has been imported, which during a trial is
normal rather than a problem.
What Expiry Does, and Does Not Do
When a trial runs out, or a licence expires, BabySOARus degrades rather than stops. Specifically:
- Searches still run.
exec,execgenand the alert action all still execute your code. - Your data stays where it is. Nothing is deleted, hidden, or locked.
- Saved functions, detections, tests and history remain readable and editable.
- Outbound network access from your code is denied. A call that would have
left the host returns a
status: 0response with an error on that row, rather than failing the whole batch.
So an expired install stops being able to enrich from external APIs or push to external systems. It does not stop being able to search, and it does not hold your work hostage.
This is deliberate, and section 6 of the licence agreement commits us to it: we will not make expiry behaviour more restrictive than this for a licence already bought.
Buying a Licence
Email sales@hisn.io with your company name and how many deployments you are licensing. You get an invoice within one business day, and the licence file and its public key as soon as it is paid -- usually the same day. Pricing is published: $12,000 per year per Splunk deployment -- a search head or a whole search head cluster -- with unlimited users and executions. Details and terms: babysoarus.hisn.io/pricing.
Installing a Licence
You will receive a licence file, which is a signed certificate that looks like this:
-----BEGIN LICENSE FILE-----
eyJlbmMiOiJleUprWVhSaElqcDdJbWxrSWpvaVkyTXpNamN5Tm1JdC...
-----END LICENSE FILE-----
Paste it into Install a Licence, on the Licence page, together with the public key supplied alongside it. That is the whole of it: the page re-reads the status as soon as the import succeeds, so you see the licence you just installed rather than having to check separately.
The same import over REST, for scripted and air-gapped installs. It requires
the babysoarus_admin capability, as the page does:
curl -sk -u admin:PASSWORD https://localhost:8089/services/babysoarus_licence \
  -H 'Content-Type: application/json' \
  -d "$(jq -n --rawfile cert licence.cert --arg pk "$PUBLIC_KEY_HEX" \
        '{method:"licence.import",params:{cert:$cert,public_key_hex:$pk}}')"
Note the endpoint: babysoarus_licence, not babysoarus. Anything that
changes a licence travels its own route, because that is where Splunk enforces
babysoarus_admin -- the ordinary route needs only babysoarus_edit, which
every power user holds. Sending these two methods to the ordinary route is
refused, with a message saying so.
public_key_hex is our account's Ed25519 public key, supplied with your
licence. It is a public key: it verifies the signature and cannot issue one.
Verification is entirely offline. The daemon checks the signature against that key and reads the licence out of the certificate. It does not contact us, and it does not need outbound network access to do it, which is what makes this work in an air-gapped deployment.
After importing, licence.status reports the licence rather than the trial:
{
  "found": true,
  "state": "valid",
  "license_id": "cc32726b-beec-49e3-8831-e699b4e614a6",
  "expires_at": "2027-08-21T16:56:35Z",
  "edition": "standard",
  "enforcement_mode": "trial",
  "degraded": false
}
A real licence always overrides the trial clock: importing one restores full capability even if the 90 days already ran out.
The reverse is not true, and it is worth knowing before it bites. The 90-day grace is for an install that has never been licensed. Once a licence has been imported and then goes bad -- expired, wrong deployment, clock moved backwards -- the install degrades straight away. It does not fall back to a fresh trial. So a licence that lapses at renewal time takes effect immediately, and the way to avoid that is to renew rather than to rely on a grace period that does not apply.
State Values
| State | Meaning |
|---|---|
valid | In date, and bound to this deployment |
expired | Past its expiry date |
guid_mismatch | Issued for a different Splunk deployment |
clock_tampered | The system clock moved backwards since the licence was seen |
Enforcement Modes
enforcement_mode decides how strictly the licence state is applied. A fresh
install is trial.
| Mode | Behaviour |
|---|---|
trial | The shipped default. Full capability for 90 days on a never-licensed install, then degrade. A valid licence always wins; a lapsed one degrades at once, without a fresh grace period. |
off | No enforcement at all. Nothing degrades, licence or not. |
on_expiry_only | Degrade only on a definitely-expired licence. A missing licence is tolerated indefinitely. |
strict | Degrade unless a valid licence is present. No trial grace. |
To change it, with babysoarus_admin:
curl -sk -u admin:PASSWORD https://localhost:8089/services/babysoarus_licence \
  -H 'Content-Type: application/json' \
  -d '{"method":"licence.enforcement.set","params":{"mode":"strict"}}'
The babysoarus_licence route again, for the same reason.
A change takes up to 60 seconds to take effect, because the mode is cached per daemon to keep it off the per-search path. That lag is fine for a commercial gate and is not a security boundary.
What Is Licensed
One licence covers one Splunk deployment: a single search head, or a single search head cluster regardless of member count. There is no per-user or per-search charge, and no execution metering.
Editions
The licence names an edition in its metadata, reported as edition. There is
currently one, standard.
A licence that names no edition reports unspecified. That is not an error and
nothing is gated by it today, but it does mean the licence was issued without
the field set, which is worth telling us about.
Frequently Hit Problems
licence file did not verify -- the certificate and the public key do not
match. Check you are using the public key supplied with that licence, and that
the certificate was copied whole, including both -----BEGIN/-----END lines.
guid_mismatch -- the licence was issued against a different Splunk
deployment. This happens when a licence is moved between environments. Ask us
to reissue it.
clock_tampered -- the system clock has moved backwards since the licence
was last checked. Usually an NTP correction or a restored VM snapshot rather
than anything sinister; it clears once the clock is past the previous
high-water mark.
403 on an import -- either the account does not hold babysoarus_admin
(the admin role does, power does not), or the call went to
/services/babysoarus instead of /services/babysoarus_licence. The message
says which.
Reading licence.status needs no capability at all, and that is
deliberate. Degrade-not-disable only works if a user whose function has just
lost network access can find out why, and most users are not administrators.
Only the two methods that change a licence are restricted.
Security Model
- The Short Version
- The Sandbox
- What Guest Code Can Reach
- Network Policy
- Secrets
- The Daemon Socket
- TLS
- Proxies
- Restricting Who Can Run It
- Resource Limits
- Supply Chain
- Reporting a Vulnerability
exec runs code an analyst typed into a search bar. This page is what that
does and does not let them do.
The Short Version
Guest code runs inside a WebAssembly component. It has no sockets, no subprocesses, no environment variables, and no filesystem beyond the lookup directories you expose. It cannot see the daemon's memory, other searches, or the host at all except through the interfaces its world declares.
What it can do is make outbound HTTP requests and read and write lookup
files, both by design. Treat exec as equivalent to | script: powerful,
and worth restricting to people you would trust with it.
The Sandbox
| Network | None directly. Outbound HTTP goes through wasi:http, performed by the host and checked against the network policy. |
| Filesystem | Only the mounted lookup directories. No other path is reachable. |
| Environment | None. The daemon's own environment can hold credentials and is never exposed. |
| Processes | None. No subprocess, no fork, no exec. |
| Memory | Isolated per instance. A guest cannot address the host or another instance. |
| Time | Hard execution deadline, enforced by interrupting the guest. |
The deadline is real and worth emphasising, because the previous implementation had none. An infinite loop in a snippet is interrupted after 30 seconds by default, and the search reports a clear error. It cannot hang a search head.
What Guest Code Can Reach
Lookup directories are mounted at /lookups/system and
/lookups/apps/<app> for every app with a lookups directory, read/write.
Guest code can therefore read and modify lookup files. If that is too much,
remove the lookups directories from the apps you do not want exposed, or run
the daemon as a user without write access to them.
Outbound HTTP goes wherever the search author asks, unless you write a network policy.
Requests travel over wasi:http, and every one of them is checked against the policy before a
connection is opened. See Network policy below.
Splunk's own API is different, and deliberately so. splunk_request names
a path, not a URL. The host resolves it against the base_url splunkd
supplied for this search, refuses anything that parses as an absolute URL,
and attaches the credentials itself, after resolving. Guest code therefore
cannot aim this search's Splunk token at another host, and a guest-supplied
Authorization header is replaced rather than added alongside.
Those credentials are also exposed to inline snippets as auth_headers. That
name is deprecated and will be removed; nothing needs it, because
splunk_request attaches credentials itself. They are the credentials of
whoever ran the search, so guest code cannot reach anything that user could
not.
Credentials are cleared from an instance's state when a run ends. A pooled instance reused by a different search never sees the previous search's token.
Network Policy
By default there is no policy and guest HTTP is unrestricted, which is how
every release so far behaved. Create config/acl.json in the app directory
and the daemon enforces it from the next restart.
{
  "allow_hosts": ["api.example.com", "*.threatintel.example"],
  "deny_hosts": ["internal.example.com"],
  "allow_ports": [443],
  "allow_methods": ["GET", "POST"],
  "secrets": [
    {
      "host": "api.example.com",
      "header": "Authorization",
      "env": "BABYSOARUS_SECRET_EXAMPLE"
    }
  ]
}
Everything not named is denied. Anything you leave out has a safe default: HTTPS only, port 443 only, and private, loopback and link-local addresses refused outright, which is most of the protection against a snippet being talked into fetching a cloud metadata endpoint.
| Key | Default | Meaning |
|---|---|---|
enabled | true | Set false to stage a policy without enforcing it |
allow_http | false | Permit plaintext HTTP |
allow_hosts | none | Hosts guest code may reach. *.example.com matches any subdomain but not example.com |
deny_hosts | none | See the warning below |
allow_ports | [443] | Ports, or [80, 443] with allow_http |
allow_methods | all | Permitted HTTP methods |
allow_non_global_ips | false | Permit private, loopback and link-local addresses |
secrets | none | Credentials the host attaches, see below |
Allow is evaluated before deny. This is the sharpest edge in the policy
and it is inherited from the ACL library. Allowing *.example.com while
denying secret.example.com still allows secret.example.com. Use deny
entries only to carve out of a broader default, and prefer being specific
in allow_hosts.
A policy that cannot be read or does not validate denies everything and logs loudly, rather than failing open. A policy file that is simply absent leaves egress unrestricted.
Secrets
Guest code should never hold a credential, and with a policy it does not have
to. Each entry in secrets binds a header to a host pattern, and the host
attaches it after the policy has approved the request:
{ "host": "api.example.com", "header": "Authorization", "env": "BABYSOARUS_SECRET_EXAMPLE" }
The value comes from the daemon's environment, which the sandbox cannot read,
because guest instances are built with no environment at all. A snippet
calling http_request('GET', 'https://api.example.com/v1/indicators') is
authenticated without ever seeing the token, and the same snippet pointed at
another host sends nothing, because the secret is bound to the pattern.
Because it is bound to a host pattern and applied after the policy check, a secret can only reach a destination the policy already permits.
env names a variable rather than holding a value, so the policy file can be
copied around by the deployer and end up in backups without carrying
credentials with it. Splunk's storage/passwords is the intended source and
arrives with the management UI; until then, set the variable in the
environment the daemon starts in.
The Daemon Socket
var/daemon.sock is mode 0600, owned by the account Splunk runs as. Anyone
who can connect to it can execute arbitrary sandboxed code with whatever
credentials they supply, so the permission matters and the daemon sets it
explicitly rather than trusting the umask.
There is no network listener. The socket is the only interface.
TLS
Outbound requests are fully certificate-verified, with one deliberate exception.
Splunk's management port presents a self-signed certificate whose name does
not match 127.0.0.1, so a strict client can never talk to it, and calling
it is the single most common thing inline code does. Verification is relaxed
only for splunk_request, and only when the base_url splunkd supplied for
this search is a loopback address.
Every other destination keeps full verification, including everything reached
through http_request. A URL that merely looks similar, such as
https://127.0.0.1.attacker.example/, is not loopback, and a non-loopback
base_url does not unlock the relaxed client either.
If you have replaced Splunk's default certificate with a trusted one, set
BABYSOARUS_STRICT_SPLUNK_TLS=1 and the exception disappears.
Proxies
splunk_request is never proxied. Sending https://localhost:8089 to a
corporate proxy either fails or, worse, resolves somewhere unintended.
http_request does not currently honour HTTP_PROXY, HTTPS_PROXY or
NO_PROXY. It did before general egress moved to wasi:http; the WASI
implementation connects directly. If your deployment requires egress through
a proxy, that is a real regression for now, and the fix belongs in the host
rather than in the sandbox.
Restricting Who Can Run It
exec and execgen are registered is_risky = true, so Splunk Web warns
before running a search loaded from a link or URL.
To restrict them properly, use Splunk's own capability model. Put the
commands in a role-restricted app, or limit the relevant capability in
authorize.conf as your Splunk version supports.
The same reasoning applies to the alert action: whoever can edit a saved search can make it run code on a schedule.
Resource Limits
| Execution time | 30 s per micro-batch, BABYSOARUS_TIMEOUT_EXECUTE_SECS |
| Run setup | 60 s, BABYSOARUS_TIMEOUT_BEGIN_RUN_SECS |
| HTTP response body | 64 MB on splunk_request, then the request fails |
| HTTP timeout | 300 s ceiling on splunk_request, whatever the guest asks for |
| Linear memory | 1 GiB per instance, enforced by the pooling allocator |
| Frame size | 64 MB on the daemon protocol |
A guest exceeding any of them fails its batch. None of them can take the daemon down.
Supply Chain
The bundled interpreter is built from python/exec_component/ by
componentize-py and shipped as a .wasm and a precompiled .cwasm. Both
are build artefacts you produce, not binaries downloaded at run time.
Custom functions you install are exactly as trustworthy as wherever you got them. They run in the same sandbox as inline Python, with the same limits, so a malicious component is bounded by everything on this page. It is not bounded by your review process, so review them.
Vendored Python dependencies are pulled from PyPI at build time by
pip install --target. Pin versions. See Dependencies.
Reporting a Vulnerability
Please report security issues privately rather than in a public issue.
Overview for SOC Teams
- The Problem with SPL for Detection Logic
- What Changes
- The Four Places It Plugs in
- A Worked Example
- Getting the Data Right First
- Where to Next
If you build detections, hunt, or respond to alerts in Splunk, this is the chapter that matters.
The Problem with SPL for Detection Logic
SPL is excellent at finding and aggregating events. It is poor at expressing judgement, and detection engineering is mostly judgement.
Consider a rule you have probably written: "alert when a host talks to a domain that looks algorithmically generated, but only if the volume is unusual for that host, and not if the domain is on our allow-list, and treat first-party CDNs differently".
In SPL that becomes a chain of eval expressions, three lookups, a subsearch
you are slightly afraid of, and a comment explaining what the regular
expression on line 14 is for. It works. Nobody wants to change it.
In Python it is thirty readable lines with a name for each concept.
What Changes
Logic lives where you can read it. Loops, dictionaries, functions,
try/except. A detection becomes something a new starter can follow.
Enrichment happens inline. Threat intelligence, asset ownership, identity context: fetch it in the same search that found the event, rather than in a lookup that is refreshed by a different job you also have to maintain.
Iteration is instant. Change five characters, press enter. No app to package, no restart, no change request.
The prototype is the production artefact. The snippet you refined interactively is the same code the scheduled alert runs and the alert action executes. There is no rewrite step where the logic drifts.
The Four Places It Plugs in
| Where | Command | Runs |
|---|---|---|
| Detections | exec | In a scheduled search, shaping and scoring what it finds |
| Threat hunting | exec | Interactively, while you think |
| Adaptive response | exec in a saved search | From an Enterprise Security notable |
| Alert actions | execalert | After a scheduled search fires, over its results |
And one that does not fit a table: Response plans, where the same code drives multi-step containment.
A Worked Example
Data exfiltration to a newly-registered domain. The detection has to combine volume, domain shape and history, which is three different kinds of judgement.
index=proxy earliest=-1h
| stats sum(bytes_out) as bytes_out count as requests
        dc(http_user_agent) as agents by host, user, dest_host
| exec inline="import math

def entropy(text):
    counts = {}
    for ch in text:
        counts[ch] = counts.get(ch, 0) + 1
    total = len(text)
    return -sum((c/total) * math.log2(c/total) for c in counts.values())

ALLOWED_SUFFIXES = ('.microsoft.com', '.github.com', '.splunk.com', '.gov.uk')

findings = []
for e in events:
    domain = e['dest_host']
    if domain.endswith(ALLOWED_SUFFIXES):
        continue

    labels = domain.split('.')
    score = 0
    reasons = []

    h = entropy(domain)
    if h > 3.6:
        score += 30
        reasons.append(f'high entropy ({h:.2f})')

    longest = max(len(l) for l in labels)
    if longest > 15:
        score += 25
        reasons.append(f'long label ({longest} chars)')

    megabytes = int(e['bytes_out']) / 1048576
    if megabytes > 50:
        score += 30
        reasons.append(f'{megabytes:.0f} MB outbound')

    if int(e['agents']) == 1 and int(e['requests']) > 50:
        score += 15
        reasons.append('single user agent, high volume')

    if score >= 50:
        e['risk_score'] = score
        e['reasons'] = reasons
        e['megabytes_out'] = round(megabytes, 1)
        e['entropy'] = round(h, 2)
        findings.append(e)

events = findings"
| sort - risk_score
| table host user dest_host risk_score megabytes_out entropy reasons

Every threshold has a name. Every contribution to the score is attached to the result as a reason, so the analyst who picks up the alert can see why it fired without opening the detection. That last property is worth more than the detection itself.
Getting the Data Right First
Do the heavy lifting in SPL and hand a small, shaped result to Python.
index=proxy
| stats sum(bytes_out) as bytes_out by host, dest_host   ← SPL: aggregate
| exec inline="..."                                       ← Python: judge
Aggregating 4 million events into 300 rows and then scoring them is fast. Scoring all 4 million works too, but there is rarely a reason to.
Where to Next
- Detections for scheduled rules and scoring.
- Threat hunting for the interactive workflow.
- Replacing SOAR workflows if you are carrying a SOAR platform for a handful of playbooks.
- AI agents if you are pointing a model at your data.
Detections
- Classify, Do Not Just Threshold
- Score with Reasons Attached
- Enrich While You Detect
- Sequences and State
- Suppression That Survives Review
- Decode What Is Hiding
- Turning It into an Alert
- Testing a Detection
Patterns for writing detection rules where the logic lives in Python and the data reduction stays in SPL.
Every example runs against the babysoarus_demo index from
scripts/seed-demo-data.sh, and every one ships with the app: they are the
built-in entries under detections/ in the editor's file
tree, there to read, run and copy.
Classify, Do Not Just Threshold
A threshold tells you something crossed a line. A classification tells you what happened, which is what the analyst needs.
index=babysoarus_demo sourcetype=babysoarus:auth action=failure
| stats dc(user) as users_targeted count as attempts values(user) as targets by src_ip
| exec inline="for e in events:
    users = int(e['users_targeted'])
    attempts = int(e['attempts'])
    ratio = attempts / users if users else attempts

    e['attempts_per_user'] = round(ratio, 2)
    if users >= 8 and ratio < 6:
        e['pattern'] = 'password spray'
        e['severity'] = 'high'
        e['action'] = 'block source, force reset for targeted accounts'
    elif ratio >= 6:
        e['pattern'] = 'brute force'
        e['severity'] = 'medium'
        e['action'] = 'lock the targeted account, check for success events'
    else:
        e['pattern'] = 'noise'

events = [e for e in events if e['pattern'] != 'noise']"
| table src_ip pattern severity users_targeted attempts attempts_per_user action

Many accounts with few attempts each is spraying. One account with many attempts is brute force. Same source data, different response, and the rule says which.
Score with Reasons Attached
Numeric scores age badly because nobody remembers what went into them. Emit the reasons alongside.
index=babysoarus_demo sourcetype=babysoarus:proxy
| stats sum(bytes_out) as bytes_out count as requests
        values(http_user_agent) as agents by host, user, dest_host
| exec inline="import math

def entropy(text):
    counts = {}
    for ch in text:
        counts[ch] = counts.get(ch, 0) + 1
    return -sum((c/len(text)) * math.log2(c/len(text)) for c in counts.values())

SUSPICIOUS_AGENTS = ('python-requests', 'curl/', 'powershell')

out = []
for e in events:
    score, reasons = 0, []
    domain = e['dest_host']

    h = entropy(domain)
    if h > 3.6:
        score += 30; reasons.append(f'entropy {h:.2f}')

    longest = max(len(l) for l in domain.split('.'))
    if longest > 15:
        score += 25; reasons.append(f'{longest}-character label')

    mb = int(e['bytes_out']) / 1048576
    if mb > 50:
        score += 30; reasons.append(f'{mb:.0f} MB outbound')

    agents = e['agents'] if isinstance(e['agents'], list) else [e['agents']]
    if any(a.lower().startswith(SUSPICIOUS_AGENTS) for a in agents):
        score += 20; reasons.append('scripted user agent')

    if score >= 50:
        e.update(risk_score=score, reasons=reasons,
                 entropy=round(h, 2), megabytes_out=round(mb, 1))
        out.append(e)

events = out"
| sort - risk_score
| table host user dest_host risk_score reasons megabytes_out entropy
The reasons field arrives in Splunk as a multivalue field, so it renders as
a readable list in the results and in the alert email.
Enrich While You Detect
Fetch context in the same search rather than maintaining a separate lookup refresh job. Call the API once per batch, never once per event.
index=babysoarus_demo sourcetype=babysoarus:proxy
| stats count by dest_host
| exec inline="
domains = [e['dest_host'] for e in events]

# One request for the whole batch.
r = http_request(
    'POST',
    'https://intel.example.internal/api/v2/bulk',
    headers={'Authorization': 'Bearer ' + context.get('intel_token', ''),
             'Content-Type': 'application/json'},
    body={'indicators': domains},
    timeout=15,
)

verdicts = {}
if r['status'] == 200:
    verdicts = {v['indicator']: v for v in json.loads(r['body'])['results']}

for e in events:
    verdict = verdicts.get(e['dest_host'], {})
    e['intel_verdict'] = verdict.get('verdict', 'unknown')
    e['intel_confidence'] = verdict.get('confidence', 0)
    e['first_seen'] = verdict.get('first_seen', '')

events = [e for e in events if e['intel_verdict'] in ('malicious', 'suspicious')]"
If the API is down, r['status'] is not 200, verdicts stays empty, and
everything is marked unknown rather than the search failing. Decide
deliberately whether an enrichment outage should fail the detection or degrade
it.
Sequences and State
Some detections need to remember what came before. The namespace persists across micro-batches within a search, so it can.
index=babysoarus_demo sourcetype=babysoarus:auth
| sort 0 _time
| exec inline="
try:
    history
except NameError:
    history = {}
    findings = []

for e in events:
    user = e.get('user', '')
    state = history.setdefault(user, {'failures': 0, 'sources': set()})

    if e.get('action') == 'failure':
        state['failures'] += 1
        state['sources'].add(e.get('src_ip', ''))
    elif e.get('action') == 'success' and state['failures'] >= 10:
        findings.append({
            'user': user,
            'src_ip': e.get('src_ip', ''),
            'preceding_failures': state['failures'],
            'distinct_sources': len(state['sources']),
            'pattern': 'successful login after sustained failures',
            'severity': 'critical',
        })
        state['failures'] = 0

events = findings"
sort 0 _time matters: the events must reach the snippet in order for the
sequence to mean anything.
Under distributed search this state is per indexer. When the sequence must span the whole estate, aggregate with
statsfirst and run the snippet on the search head.
Suppression That Survives Review
Allow-lists written as SPL NOT clauses become unreadable. Written as data,
they stay legible.
| exec inline="
SUPPRESSIONS = [
    # Vulnerability scanner, expected to touch everything.
    {'field': 'src_ip', 'equals': '10.20.0.51', 'owner': 'infra', 'expires': '2026-12-31'},
    # Backup service, high volume by design.
    {'field': 'user', 'equals': 'svc_backup', 'owner': 'platform', 'expires': '2026-09-30'},
    # First-party CDN.
    {'field': 'dest_host', 'endswith': '.cdn.example.com', 'owner': 'web', 'expires': '2027-01-31'},
]

import datetime
today = datetime.date.today().isoformat()

def suppressed(event):
    for rule in SUPPRESSIONS:
        if rule['expires'] < today:
            continue
        value = event.get(rule['field'], '')
        if 'equals' in rule and value == rule['equals']:
            return rule
        if 'endswith' in rule and value.endswith(rule['endswith']):
            return rule
    return None

kept = []
for e in events:
    rule = suppressed(e)
    if rule is None:
        kept.append(e)
    else:
        e['suppressed_by'] = rule['owner']
events = kept"
Each suppression has an owner and an expiry, and expired ones stop applying on their own. That is difficult to express in SPL and trivial here.
Decode What Is Hiding
Attackers encode. Base64 in a command line, hex in a DNS label, URL encoding in a proxy log.
index=babysoarus_demo sourcetype=babysoarus:proxy
| exec inline="import base64, binascii, urllib.parse, re

B64 = re.compile(r'[A-Za-z0-9+/]{20,}={0,2}')
KEYWORDS = ('powershell', 'invoke-', 'downloadstring', '/bin/sh', 'certutil')

out = []
for e in events:
    url = urllib.parse.unquote(e.get('uri', ''))
    decoded = []
    for candidate in B64.findall(url):
        try:
            text = base64.b64decode(candidate + '===').decode('utf-8', 'ignore')
        except (binascii.Error, ValueError):
            continue
        if any(k in text.lower() for k in KEYWORDS):
            decoded.append(text[:200])
    if decoded:
        e['decoded_payloads'] = decoded
        e['severity'] = 'critical'
        out.append(e)

events = out"
Turning It into an Alert
Save the search, schedule it, and attach the alert action if you want code to run over the results too:
[Exfiltration to high-entropy domain]
search = index=proxy | stats ... | exec inline="..."
cron_schedule = */15 * * * *
dispatch.earliest_time = -15m
dispatch.latest_time = now
enableSched = 1
counttype = number of events
relation = greater than
quantity = 0
action.execalert = 1
action.execalert.param.inline = for e in events: e['case_priority'] = 'P1' if int(e['risk_score']) > 70 else 'P2'
Testing a Detection
Feed it known-bad data and assert on the verdict:
| makeresults
| eval dest_host="kq3n8vhs2wpxl4td.exfil-node.top", bytes_out="119681422", requests="18"
| exec inline="..."
| eval test_passed = if(risk_score >= 50, "pass", "FAIL")
Put a handful of those in a saved search and you have a regression test that runs on a schedule and tells you when a detection has stopped working.
Threat Hunting
- Beaconing
- DNS Tunnelling
- Rare Things
- Stacking with Judgement
- Enriching Mid-hunt
- Keeping What You Find
- Practical Notes
Hunting is iteration. You have a hypothesis, you look, the data says something you did not expect, you change the question. Anything that adds friction between those steps costs you hunts.
BabySOARus removes the packaging step entirely. Edit the snippet, press enter.
Beaconing
Command-and-control traffic is regular. Human traffic is not. The measure is the variability of the gaps between requests.
index=babysoarus_demo sourcetype=babysoarus:proxy
| sort 0 src_host, dest_host, _time
| streamstats current=f last(_time) as previous by src_host, dest_host
| eval gap = _time - previous
| where isnotnull(gap)
| stats count as intervals avg(gap) as mean_gap stdev(gap) as stdev_gap
        by src_host, dest_host
| where intervals >= 8
| exec inline="
for e in events:
    mean = float(e['mean_gap'])
    stdev = float(e.get('stdev_gap') or 0)
    if mean <= 0:
        continue
    jitter = stdev / mean
    e['interval_seconds'] = round(mean)
    e['jitter'] = round(jitter, 3)
    e['beacon_score'] = round(max(0.0, 1 - jitter) * 100)
    e['assessment'] = (
        'machine-regular, investigate' if jitter < 0.1 else
        'semi-regular, worth a look' if jitter < 0.35 else
        'human-like'
    )"
| sort - beacon_score
| table src_host dest_host intervals interval_seconds jitter beacon_score assessment
Two details worth copying. The interval statistics are computed in SPL because
stats list() caps at 100 values, so gathering raw timestamps would silently
work on a truncated sample. And the sort happens in SPL after the command,
because a snippet only ever sees one micro-batch.

The result is unambiguous. One destination scores 98 with a jitter of 0.018 and a 180-second interval. Everything legitimate sits at 20 or below, because people browse irregularly and machines do not.
This is roughly forty lines of streamstats and eventstats in SPL, and the
SPL version is harder to tune.
DNS Tunnelling
Data smuggled through DNS produces long, high-entropy labels and a lot of TXT queries.
index=babysoarus_demo sourcetype=babysoarus:dns
| stats count avg(eval(len(query))) as avg_len by src_ip, query_type
| exec inline="for e in events:
    e['avg_query_length'] = round(float(e['avg_len']), 1)
    e['tunnelling_likely'] = float(e['avg_len']) > 40 and e['query_type'] == 'TXT'
    del e['avg_len']"
| sort - avg_query_length
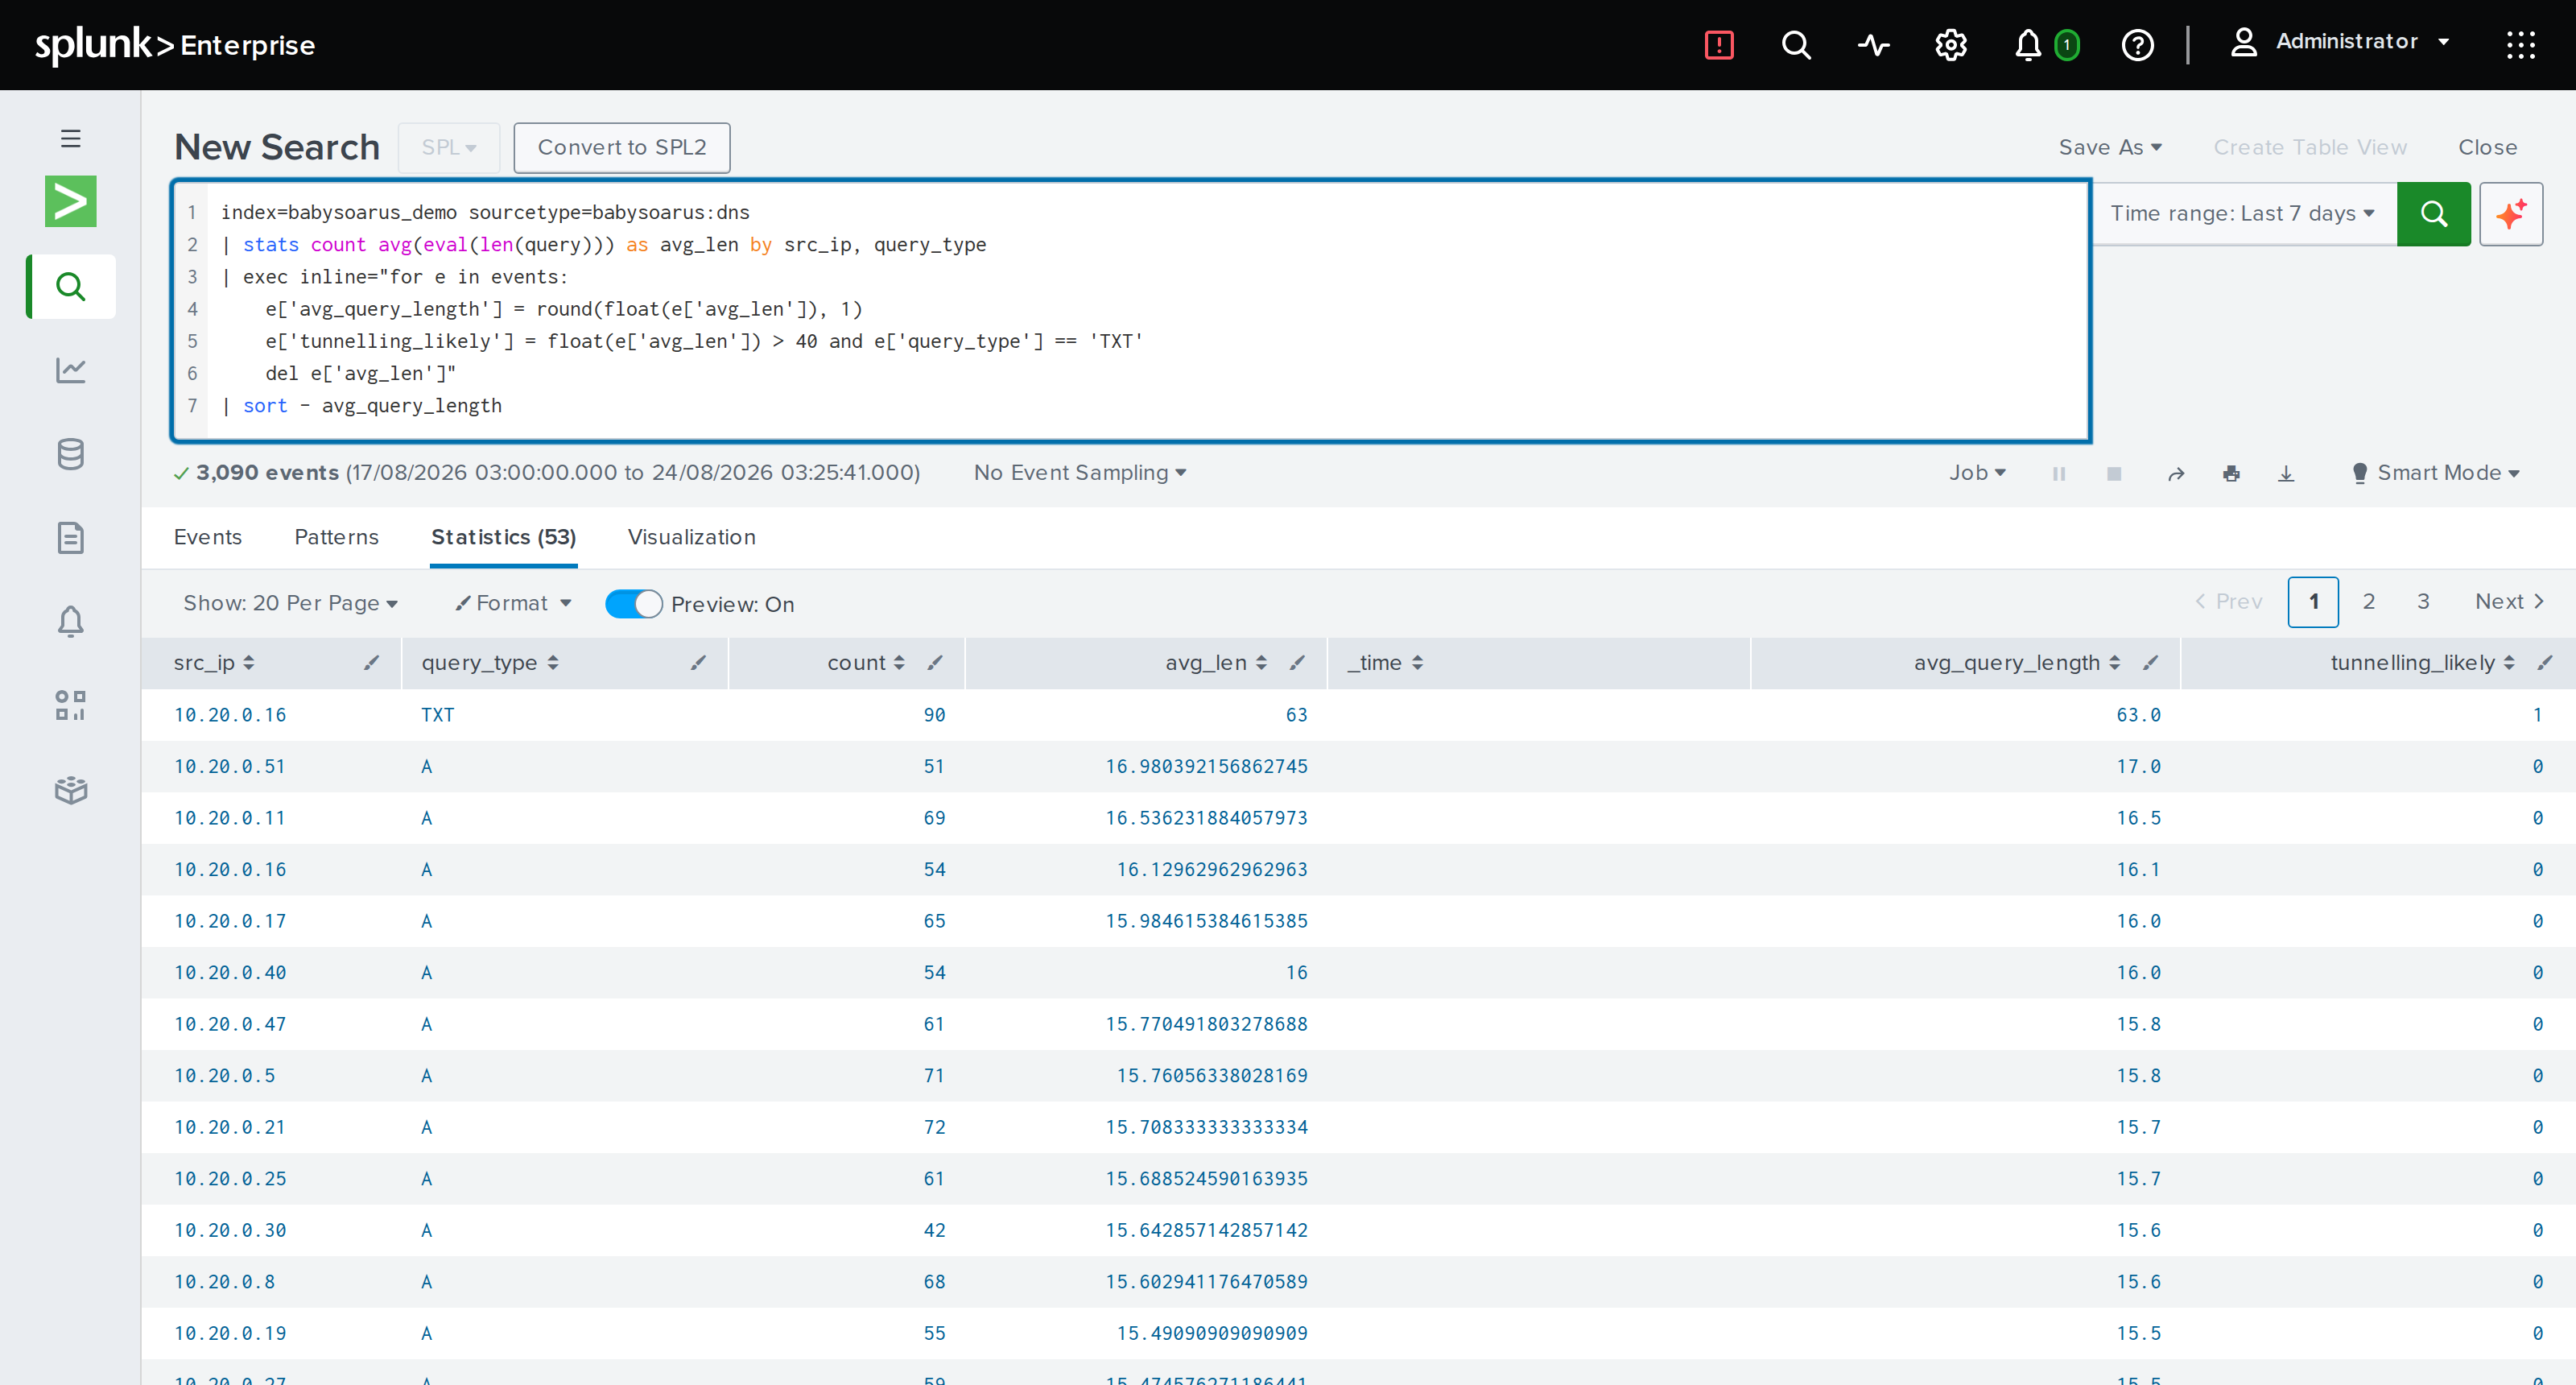
Rare Things
"Show me what is unusual for this host" is the most productive hunting question there is, and it needs per-key state.
index=babysoarus_demo sourcetype=babysoarus:proxy earliest=-7d
| stats count by host, dest_host
| exec inline="
from collections import defaultdict

by_host = defaultdict(dict)
for e in events:
    by_host[e['host']][e['dest_host']] = int(e['count'])

out = []
for host, destinations in by_host.items():
    total = sum(destinations.values())
    for domain, count in destinations.items():
        share = count / total
        if share < 0.001 and count <= 3:
            out.append({
                'host': host,
                'dest_host': domain,
                'requests': count,
                'share_of_host_traffic': f'{share * 100:.4f}%',
                'why': 'rare for this host',
            })

events = sorted(out, key=lambda e: e['requests'])"
Stacking with Judgement
Frequency analysis is standard practice. What SPL cannot easily do is apply judgement to the long tail.
index=babysoarus_demo sourcetype=babysoarus:proxy
| stats count values(host) as hosts by http_user_agent
| exec inline="import re

BROWSER = re.compile(r'(Mozilla|Chrome|Safari|Firefox|Edge)/[\d.]+')
TOOLING = re.compile(r'(curl|wget|python-requests|powershell|Go-http-client|axios)', re.I)

for e in events:
    agent = e['http_user_agent']
    hosts = e['hosts'] if isinstance(e['hosts'], list) else [e['hosts']]

    if TOOLING.search(agent):
        e['category'] = 'tooling'
        e['interest'] = 'high' if len(hosts) <= 2 else 'medium'
    elif BROWSER.search(agent):
        e['category'] = 'browser'
        e['interest'] = 'low'
    else:
        e['category'] = 'unrecognised'
        e['interest'] = 'high'

    e['host_count'] = len(hosts)

events = [e for e in events if e['interest'] != 'low']"
| sort host_count
A scripted user agent on two hosts is far more interesting than the same agent on two hundred, and that judgement is one line.
Enriching Mid-hunt
When a hunt turns up something, pivot without leaving the search bar.
index=babysoarus_demo sourcetype=babysoarus:proxy dest_host="*exfil-node.top"
| stats count values(user) as users values(host) as hosts by dest_host
| exec inline="
for e in events:
    domain = e['dest_host']
    parts = domain.split('.')
    registrable = '.'.join(parts[-2:]) if len(parts) >= 2 else domain

    r = http_request('GET', f'https://rdap.org/domain/{registrable}', timeout=10)
    if r['status'] == 200:
        data = json.loads(r['body'])
        for event in data.get('events', []):
            if event.get('eventAction') == 'registration':
                e['registered'] = event.get('eventDate', '')
        e['registrar'] = data.get('entities', [{}])[0].get('handle', 'unknown')
    else:
        e['registered'] = f'lookup failed ({r[\"status\"]})'
    e['registrable_domain'] = registrable"
Domain age, in the search bar, with no add-on to install.
Keeping What You Find
A hunt that finds something should leave a detection behind. Because the snippet is the artefact, that is copy and paste:
- Narrow the snippet to the finding.
- Save the search.
- Schedule it.
- Add the alert action if it should do something.
The code that found it once is the code that finds it again. No rewrite, no translation, no drift.
Practical Notes
Reduce first. stats before exec. Score 300 rows, not 4 million events.
Watch the batch boundary. State accumulates across batches within a
search, so for e in events sees 32 events at a time. Aggregate in SPL when
you need a global view.
Use head while iterating. | head 100 | exec inline="..." makes the
edit-run loop instant while you are still getting the logic right.
table at the end. The extra fields your snippet leaves behind are
useful while hunting and noise when presenting.
Enterprise Security Adaptive Response
- How It Fits Together
- Registering the Action
- The Action Itself
- Writing Back to the Notable
- Risk-based Alerting
- Ad-hoc Actions from Incident Review
- Testing Before You Register It
Adaptive response actions in Enterprise Security run from a notable event, either automatically or when an analyst picks them from the incident review menu. Splunk ships a handful. Writing your own normally means building an add-on.
With BabySOARus, an adaptive response action is a saved search containing exec.
How It Fits Together
ES runs an adaptive response action by dispatching a saved search with the
notable's fields available as tokens. If that saved search contains exec,
your Python runs with the notable's context and can do whatever the action
needs: enrich, decide, call an API, write back to a lookup.
correlation search  ->  notable event  ->  adaptive response  ->  saved search
                                                                       |
                                                                    | exec
                                                                       |
                                                          enrich, decide, act
Registering the Action
default/savedsearches.conf in your ES content app:
[Enrich and triage notable]
action.notable = 0
dispatch.earliest_time = -5m
dispatch.latest_time = now
search = | makeresults \
| eval src = "$src$", dest = "$dest$", user = "$user$", \
       rule_name = "$rule_name$", urgency = "$urgency$" \
| exec inline="..."

[action_adaptive_response]
disabled = 0
And default/alert_actions.conf to make it selectable:
[enrich_and_triage_notable]
is_custom = 1
label = Enrich and triage (BabySOARus)
description = Enrich a notable with asset, identity and intelligence context, and set a recommended action
payload_format = json
param._cam = {"category": ["Information Gathering"], \
              "task": ["update"], \
              "subject": ["endpoint"], \
              "technology": [{"vendor": "BabySOARus", "product": "BabySOARus"}], \
              "supports_adhoc": true, \
              "drilldown_uri": "search?q=..."}
The param._cam block is what makes ES show the action in the incident review
menu and in the correlation search editor.
The Action Itself
| makeresults
| eval src="$src$", dest="$dest$", user="$user$", rule_name="$rule_name$"
| exec inline="
findings = []
for e in events:
    src, dest, user = e.get('src', ''), e.get('dest', ''), e.get('user', '')

    # 1. Asset context, from ES's own asset framework.
    asset = {}
    r = splunk_request('GET',
        f'/servicesNS/nobody/SA-IdentityManagement/storage/collections/data/asset_lookup?query={{\"ip\":\"{dest}\"}}&output_mode=json')
    if r['status'] == 200:
        rows = json.loads(r['body'])
        asset = rows[0] if rows else {}

    e['asset_owner'] = asset.get('owner', 'unassigned')
    e['asset_priority'] = asset.get('priority', 'unknown')
    e['asset_category'] = asset.get('category', '')

    # 2. Have we seen this pair before?
    r = splunk_request('GET',
        f'/services/search/jobs/export?output_mode=json&search='
        f'search index=notable src={src} dest={dest} earliest=-30d | stats count')
    seen_before = 0
    if r['status'] == 200:
        for line in r['body'].decode().splitlines():
            if line.strip():
                try:
                    seen_before = int(json.loads(line)['result']['count'])
                except (KeyError, ValueError):
                    pass
    e['prior_notables_30d'] = seen_before

    # 3. Decide.
    if e['asset_priority'] in ('critical', 'high') and seen_before == 0:
        e['recommendation'] = 'escalate to tier 2 immediately'
        e['new_urgency'] = 'critical'
    elif seen_before > 5:
        e['recommendation'] = 'likely known-good pattern, review suppression'
        e['new_urgency'] = 'low'
    else:
        e['recommendation'] = 'standard triage'
        e['new_urgency'] = 'medium'

    findings.append(e)

events = findings"
| table src dest user asset_owner asset_priority prior_notables_30d recommendation new_urgency
Three enrichments and a decision, in one place, readable end to end.
Writing Back to the Notable
Adaptive response actions commonly update the notable's status or urgency. The ES REST endpoint takes the notable's event ID:
r = splunk_request(
    'POST',
    '/services/notable_update',
    body={
        'ruleUIDs': [e['event_id']],
        'status': '2',                       # in progress
        'urgency': e['new_urgency'],
        'comment': f"BabySOARus triage: {e['recommendation']}",
    },
)
e['notable_updated'] = r['status'] == 200
Pass $event_id$ into the search alongside the other tokens to get it.
Risk-based Alerting
If you use RBA, the same mechanism assigns risk scores with logic rather than a static number per rule.
| exec inline="
for e in events:
    score = 20

    if e.get('asset_priority') == 'critical':
        score += 40
    elif e.get('asset_priority') == 'high':
        score += 25

    if e.get('user', '').startswith('svc_'):
        score += 15          # service accounts should not do this

    if int(e.get('prior_notables_30d', 0)) == 0:
        score += 20          # never seen before

    hour = int(e.get('_time_hour', 12))
    if hour < 6 or hour > 20:
        score += 10          # out of hours

    e['risk_score'] = min(100, score)
    e['risk_object'] = e.get('dest', '')
    e['risk_object_type'] = 'system'"
| collect index=risk
The contributing factors are visible in the code, which is the thing that makes an RBA implementation maintainable a year later.
Ad-hoc Actions from Incident Review
Setting "supports_adhoc": true in param._cam lets an analyst run the
action manually from a notable. That is where BabySOARus is most useful: a menu
of small, purposeful actions, each a few lines of Python.
Actions worth having:
| Action | What it does |
|---|---|
| Enrich indicators | Look up every IP, domain and hash on the notable in one API call |
| Check asset ownership | Resolve owner, business unit and criticality |
| Historical context | Count similar notables in the last 30 days |
| Decode payload | Base64 and URL decode anything embedded in the notable |
| Draft ticket | Build a formatted summary ready to paste, or post it directly |
Each is a saved search with an exec snippet, and each takes a few minutes to
write.
Testing Before You Register It
An adaptive response action is just a search, so test it as one. Substitute real values for the tokens and run it interactively:
| makeresults
| eval src="10.20.0.17", dest="10.20.0.51", user="d.harrington", rule_name="Test"
| exec inline="..."
That is the whole development loop. No add-on to reinstall, no ES restart.
Alert Actions
- Attaching It
- What the Action Receives
- Opening a Case
- Notifying with Useful Content
- Updating a Lookup
- Conditional Response
- Handling Credentials
- Debugging
- Limits
execalert runs your code over the results of a scheduled search, after it
fires. It is the difference between an alert that tells somebody and an alert
that does something.
Attaching It
In the alert editor, open Trigger actions and add Execute WASM/Python:
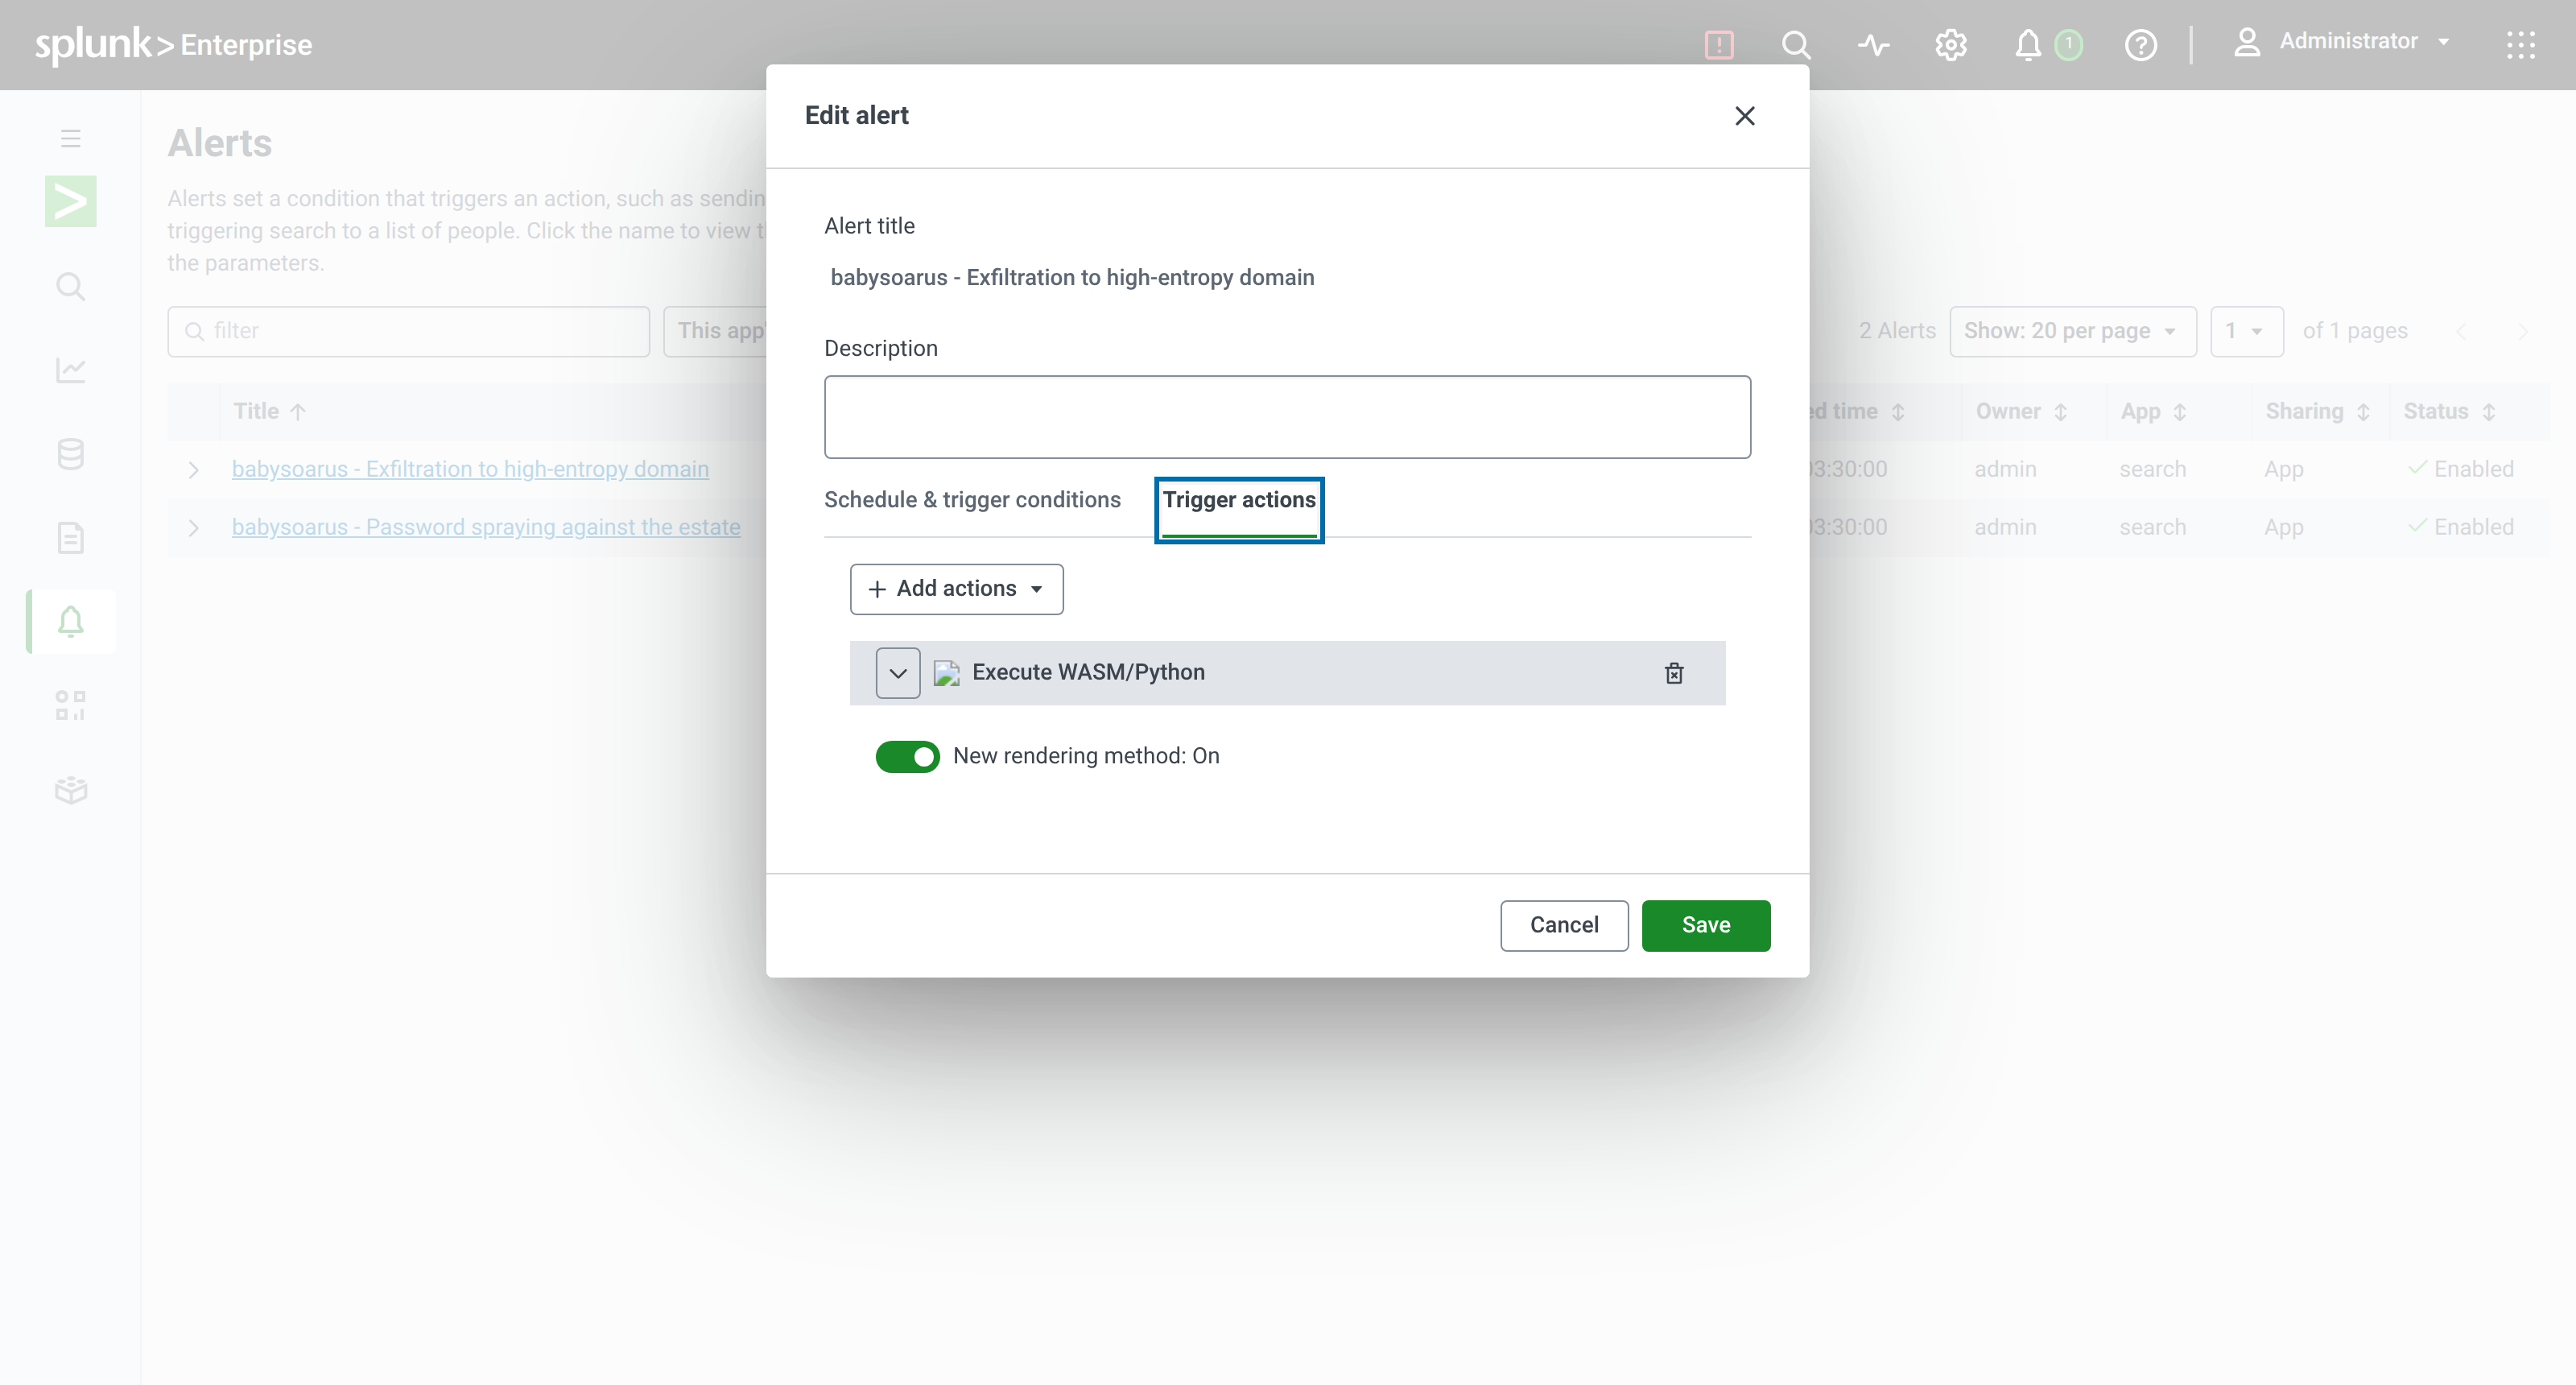
Or in savedsearches.conf:
[Exfiltration to high-entropy domain]
search = index=proxy | stats sum(bytes_out) as bytes_out by host, dest_host | exec inline="..."
cron_schedule = */15 * * * *
dispatch.earliest_time = -15m
dispatch.latest_time = now
enableSched = 1
counttype = number of events
relation = greater than
quantity = 0

action.execalert = 1
action.execalert.param.inline = for e in events:\
    e['case_priority'] = 'P1' if int(e['risk_score']) > 70 else 'P2'
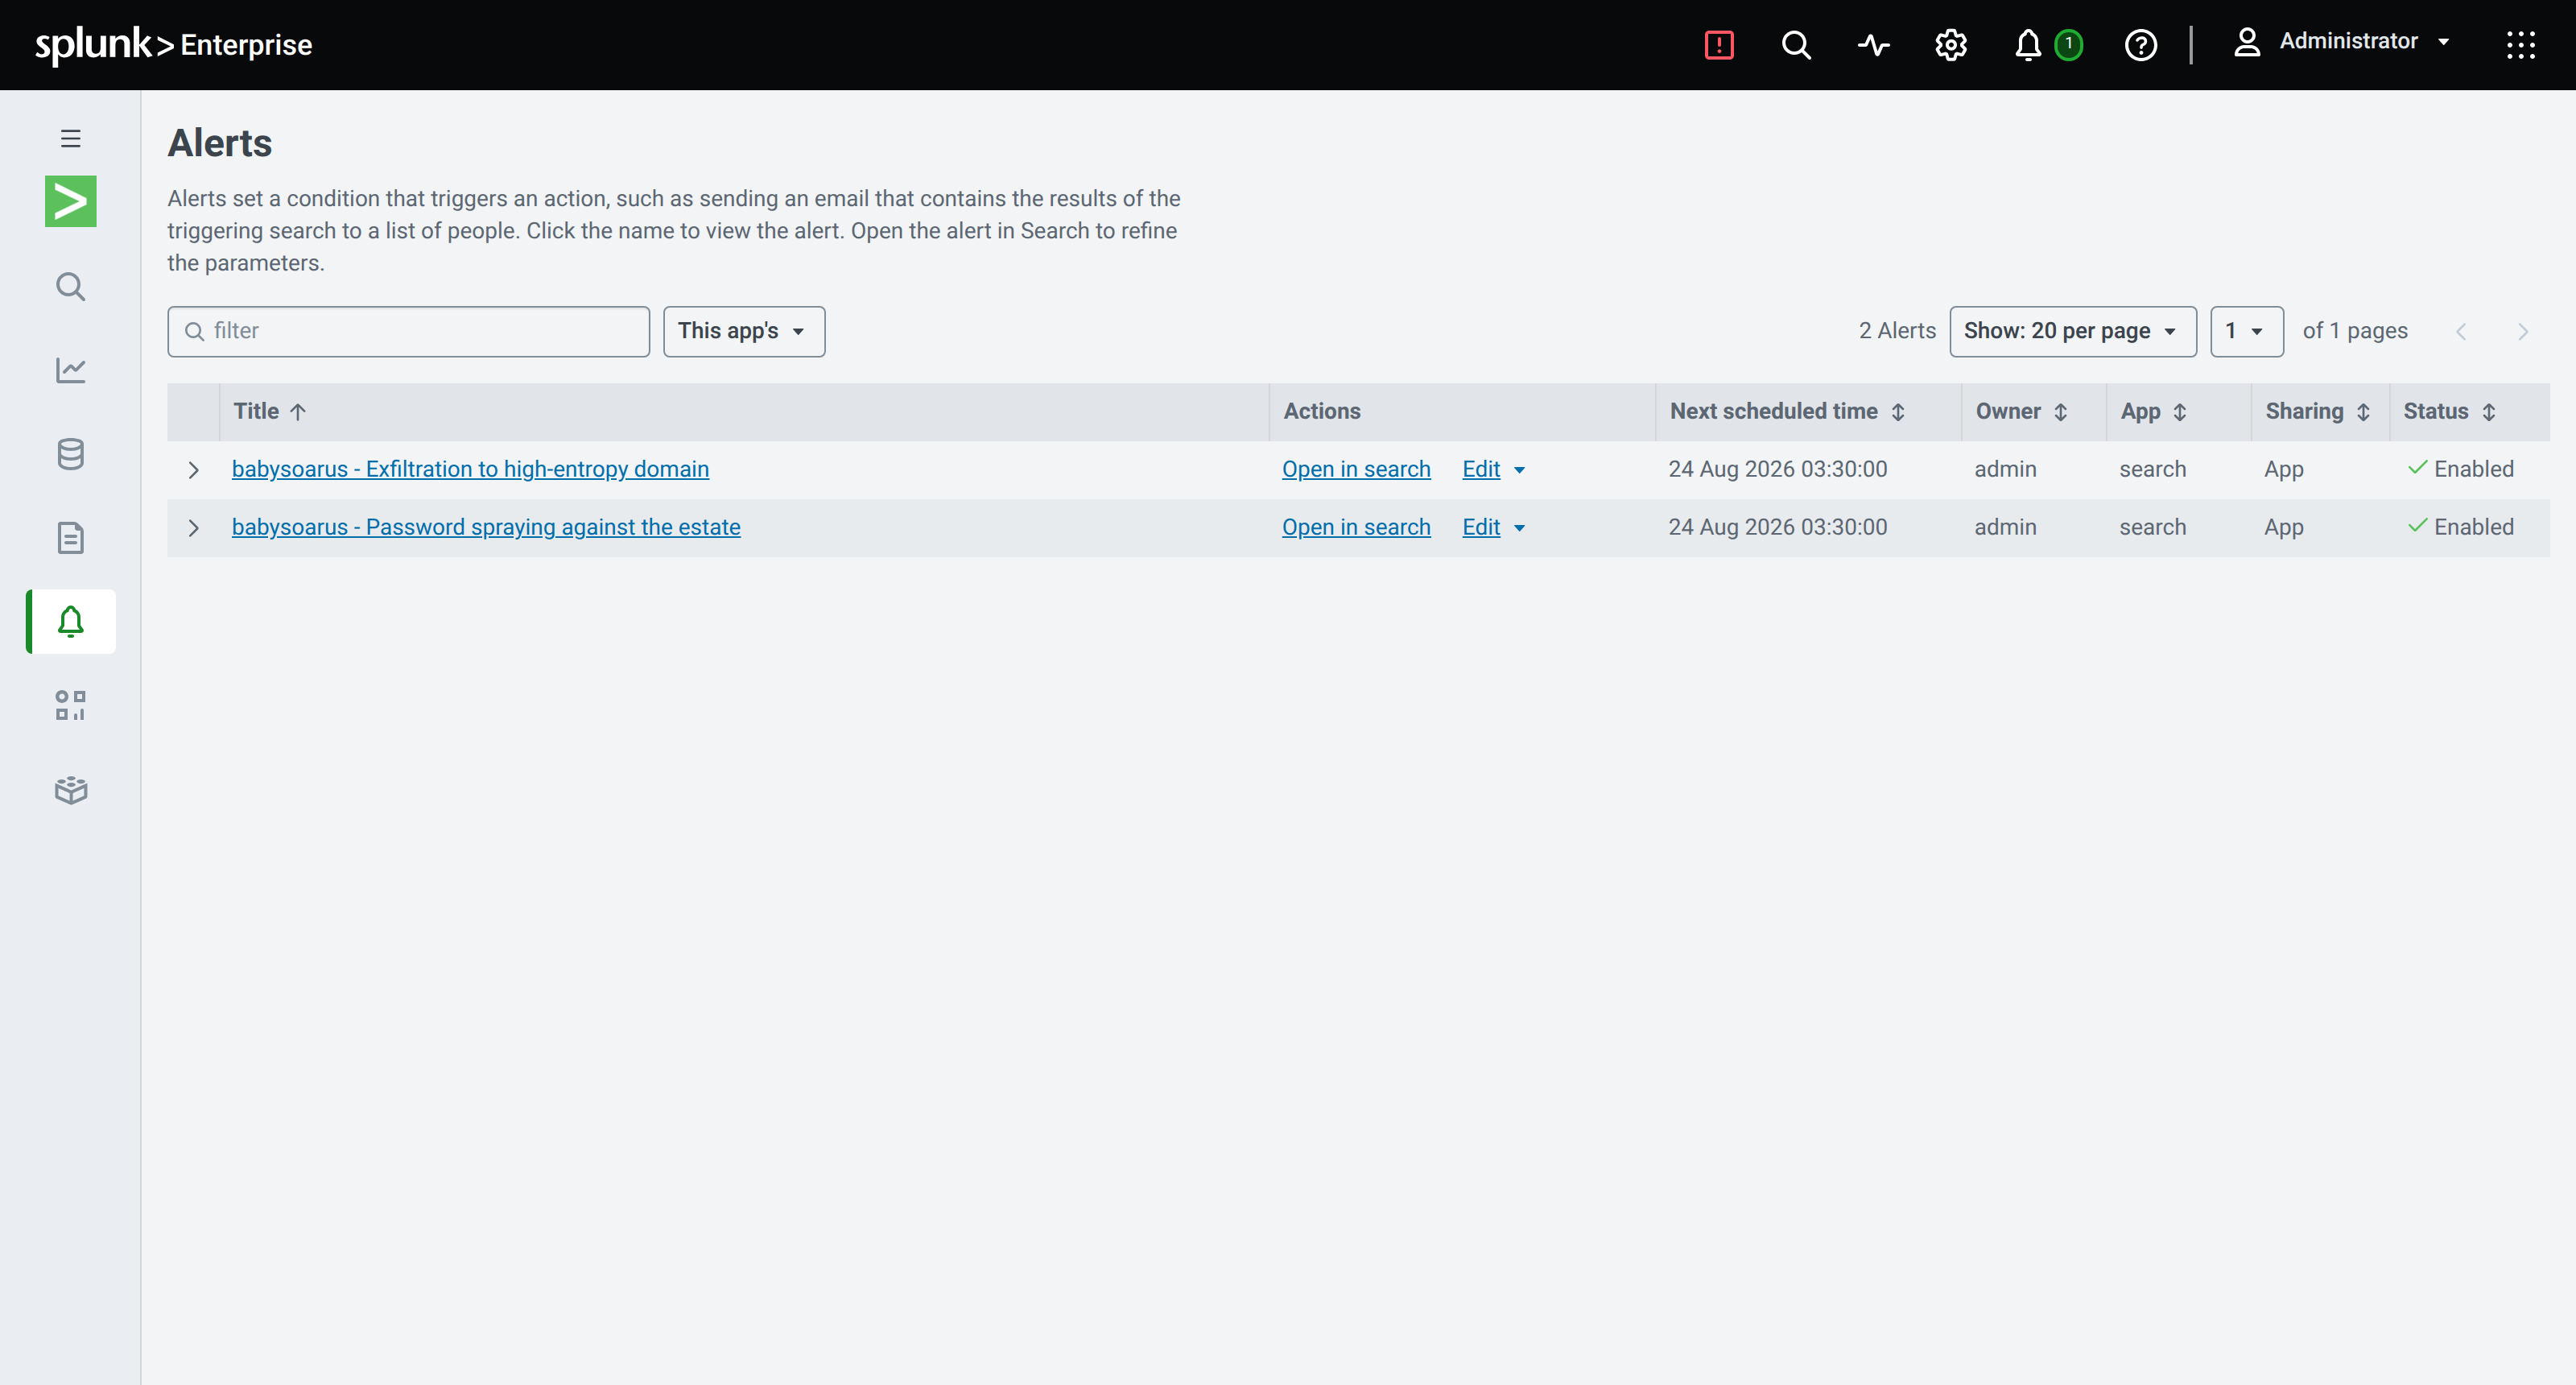
What the Action Receives
The same interface as exec: events holding the alert's result rows, plus
http_request, splunk_request, auth_headers, base_url and context.
Rows arrive in micro-batches of 32, so an alert returning 500 rows calls your code 16 times. Anything that must happen once per alert rather than once per batch needs guarding, exactly as in a search:
try:
    already_notified
except NameError:
    already_notified = set()
An alert with no results still runs the code once, with events empty, so
side-effect-only actions still fire.
Opening a Case
The most common thing an alert action does.
import datetime

if not events:
    raise SystemExit

# One case for the whole alert, not one per row.
summary = {
    'title': f"Exfiltration suspected: {len(events)} destination(s)",
    'severity': 'high' if any(int(e.get('risk_score', 0)) > 70 for e in events) else 'medium',
    'source': 'splunk/BabySOARus',
    'created': datetime.datetime.utcnow().isoformat() + 'Z',
    'observables': [
        {'type': 'domain', 'value': e['dest_host'], 'score': e.get('risk_score')}
        for e in events
    ],
    'hosts': sorted({e.get('host', '') for e in events if e.get('host')}),
    'search_name': context.get('search_name', ''),
    'sid': context.get('sid', ''),
}

r = http_request(
    'POST',
    'https://cases.example.internal/api/v1/cases',
    headers={'Authorization': 'Bearer ' + CASE_TOKEN, 'Content-Type': 'application/json'},
    body=summary,
    timeout=20,
)
if r['status'] not in (200, 201):
    raise BabysoarusError(f'case creation failed with {r["status"]}: {r["body"][:200]}')

case = json.loads(r['body'])
for e in events:
    e['case_id'] = case['id']
    e['case_url'] = case['url']
Raising fails the action, which Splunk records and shows in the alert's history. A silently half-completed action is worse than a visibly failed one.
Notifying with Useful Content
The value is not the notification, it is what is in it.
lines = []
for e in sorted(events, key=lambda e: -int(e.get('risk_score', 0)))[:5]:
    lines.append(
        f"• *{e['dest_host']}* from `{e.get('host', '?')}` "
        f"({e.get('megabytes_out', '?')} MB, score {e.get('risk_score', '?')})\n"
        f"  _{', '.join(e.get('reasons', []))}_"
    )

blocks = {
    'text': f"{len(events)} exfiltration candidate(s)",
    'blocks': [
        {'type': 'header',
         'text': {'type': 'plain_text', 'text': '🔴 Possible data exfiltration'}},
        {'type': 'section',
         'text': {'type': 'mrkdwn', 'text': '\n'.join(lines)}},
        {'type': 'context',
         'elements': [{'type': 'mrkdwn',
                       'text': f"Search: {context.get('search_name', '')} · "
                               f"<{base_url}/app/search/search?sid={context.get('sid', '')}|open in Splunk>"}]},
    ],
}

http_request('POST', WEBHOOK_URL, body=blocks, timeout=10)
The analyst who reads that message already knows what happened, which host, how much data and why it scored. They do not have to open Splunk to triage it.
Updating a Lookup
Alert actions can write lookup files, which is how you build state that outlives a single search.
import csv, os, datetime

path = '/lookups/apps/search/known_bad_domains.csv'
today = datetime.date.today().isoformat()

existing = {}
if os.path.exists(path):
    with open(path) as handle:
        existing = {row['domain']: row for row in csv.DictReader(handle)}

for e in events:
    domain = e['dest_host']
    row = existing.get(domain, {'domain': domain, 'first_seen': today, 'hits': '0'})
    row['last_seen'] = today
    row['hits'] = str(int(row.get('hits', 0)) + 1)
    row['max_score'] = str(max(int(row.get('max_score', 0)), int(e.get('risk_score', 0))))
    existing[domain] = row

with open(path, 'w', newline='') as handle:
    writer = csv.DictWriter(
        handle, fieldnames=['domain', 'first_seen', 'last_seen', 'hits', 'max_score'])
    writer.writeheader()
    writer.writerows(existing.values())
Guard the read so it happens once per alert rather than once per batch when the file is large.
Conditional Response
Not every alert deserves the same reaction. Decide in code.
CRITICAL_ASSETS = {'SRV-001', 'SRV-004', 'SRV-007'}

for e in events:
    host = e.get('host', '')
    score = int(e.get('risk_score', 0))

    if host in CRITICAL_ASSETS and score > 70:
        e['response'] = 'isolate'
        http_request('POST', f'{EDR}/api/hosts/{host}/isolate',
                     headers={'Authorization': 'Bearer ' + EDR_TOKEN}, timeout=30)
        http_request('POST', PAGER_URL,
                     body={'severity': 'critical', 'summary': f'Isolated {host}'})
    elif score > 70:
        e['response'] = 'ticket'
        http_request('POST', TICKETS_URL, body={'priority': 'P1', 'host': host})
    else:
        e['response'] = 'watchlist only'
That is a playbook. It is fifteen lines, it is in version control, and it does not need a separate platform. See Replacing SOAR workflows.
Handling Credentials
Do not put API tokens in the snippet. Splunk's secret storage is reachable through the REST API using the search's own credentials:
r = splunk_request(
    'GET',
    '/servicesNS/nobody/babysoarus/storage/passwords/%3Acase_api_token%3A?output_mode=json')
CASE_TOKEN = json.loads(r['body'])['entry'][0]['content']['clear_password']
Store the secret once with splunk edit or the REST API, and reference it by
name. The snippet then contains no secrets and is safe to commit.
Debugging
The action logs to splunkd.log, and it says what it did:
grep babysoarus-alert $SPLUNK_HOME/var/log/splunk/splunkd.log
INFO babysoarus-alert: search="Exfiltration to high-entropy domain" sid="scheduler__admin__..." rows=3
INFO babysoarus-alert: processed 3 row(s)
Failures are logged with their message and exit non-zero, so Splunk marks the action failed and shows it in the alert's action history.
To test without waiting for a schedule, run the binary directly with a payload on stdin:
echo '{
  "results_file": "/tmp/results.csv.gz",
  "server_uri": "https://127.0.0.1:8089",
  "session_key": "...",
  "search_name": "manual test",
  "configuration": {"inline": "for e in events: e[\"seen\"] = 1"}
}' | BABYSOARUS_APP_DIR=$SPLUNK_HOME/etc/apps/babysoarus \
     $SPLUNK_HOME/etc/apps/babysoarus/bin/babysoarus-alert --execute
Limits
max_resultsinalert_actions.confcaps the rows handed to the action.- The same 30-second-per-batch execution budget applies.
- The action runs on the search head that ran the search.
- A failing action does not retry. Make failures loud rather than silent.
Response Plans
- The Shape of a Plan
- A Worked Plan: Suspected Credential Compromise
- Design Notes
- Staged Rollout
- Approval Gates
- Testing
A response plan is a sequence: gather, decide, contain, record, notify. Most teams either run it by hand from a wiki page, or buy a platform to run it for them.
There is a middle option. A response plan is a function, and BabySOARus runs functions.
The Shape of a Plan
# 1. Gather
context = enrich(alert)

# 2. Decide
decision = classify(context)

# 3. Act
if decision.contain:
    isolate(context.host)

# 4. Record
case = open_case(context, decision)

# 5. Notify
notify(case, decision)
That is the whole thing, and it fits in an alert action.
A Worked Plan: Suspected Credential Compromise
Triggered by a scheduled search that finds a successful login following sustained failures.
import datetime

# --- configuration -------------------------------------------------------
IDENTITY_API = 'https://identity.example.internal/api/v1'
EDR_API = 'https://edr.example.internal/api/v3'
CASES_API = 'https://cases.example.internal/api/v1'
NEVER_DISABLE = {'svc_backup', 'svc_monitoring', 'breakglass'}

# Secrets come from Splunk's own store, never from the snippet.
def secret(name):
    r = splunk_request(
        'GET',
        f'/servicesNS/nobody/babysoarus/storage/passwords/%3A{name}%3A?output_mode=json')
    return json.loads(r['body'])['entry'][0]['content']['clear_password']

TOKENS = {'identity': secret('identity_token'), 'edr': secret('edr_token'),
          'cases': secret('cases_token')}

def call(api, method, path, token, body=None, timeout=20):
    return http_request(method, f'{api}{path}',
                        headers={'Authorization': f'Bearer {token}',
                                 'Content-Type': 'application/json'},
                        body=body, timeout=timeout)

# --- 1. gather -----------------------------------------------------------
timeline = []
for e in events:
    user, src = e.get('user', ''), e.get('src_ip', '')

    identity = {}
    r = call(IDENTITY_API, 'GET', f'/users/{user}', TOKENS['identity'])
    if r['status'] == 200:
        identity = json.loads(r['body'])

    e['department'] = identity.get('department', 'unknown')
    e['privileged'] = bool(identity.get('privileged'))
    e['manager'] = identity.get('manager_email', '')

    # Where has this account been today?
    r = splunk_request(
        'GET',
        '/services/search/jobs/export?output_mode=json&search='
        f'search index=auth user={user} earliest=-24h '
        '| stats dc(src_ip) as sources values(dest) as systems')
    if r['status'] == 200:
        for line in r['body'].decode().splitlines():
            if line.strip():
                try:
                    result = json.loads(line)['result']
                    e['sources_24h'] = int(result.get('sources', 0))
                    e['systems_touched'] = result.get('systems', [])
                except (KeyError, ValueError):
                    pass

    timeline.append(e)

# --- 2. decide -----------------------------------------------------------
for e in timeline:
    reasons = []
    severity = 'medium'

    if e['privileged']:
        severity = 'critical'
        reasons.append('privileged account')
    if int(e.get('preceding_failures', 0)) > 20:
        reasons.append(f"{e['preceding_failures']} failures before success")
    if int(e.get('sources_24h', 0)) > 5:
        severity = 'critical'
        reasons.append(f"{e['sources_24h']} distinct source addresses in 24h")

    e['severity'] = severity
    e['reasons'] = reasons
    e['contain'] = severity == 'critical' and e['user'] not in NEVER_DISABLE

# --- 3. act --------------------------------------------------------------
for e in timeline:
    e['actions_taken'] = []

    if not e['contain']:
        e['actions_taken'].append('no automatic containment')
        continue

    r = call(IDENTITY_API, 'POST', f"/users/{e['user']}/sessions/revoke",
             TOKENS['identity'])
    e['actions_taken'].append(
        'sessions revoked' if r['status'] < 300 else f"session revoke failed ({r['status']})")

    r = call(IDENTITY_API, 'POST', f"/users/{e['user']}/require-password-reset",
             TOKENS['identity'])
    e['actions_taken'].append(
        'password reset required' if r['status'] < 300 else f"reset failed ({r['status']})")

    for system in e.get('systems_touched', [])[:5]:
        r = call(EDR_API, 'POST', f'/hosts/{system}/scan',
                 TOKENS['edr'], body={'type': 'quick'})
        e['actions_taken'].append(
            f'scan queued on {system}' if r['status'] < 300 else f'scan failed on {system}')

# --- 4. record -----------------------------------------------------------
r = call(CASES_API, 'POST', '/cases', TOKENS['cases'], body={
    'title': f"Credential compromise: {', '.join(sorted({e['user'] for e in timeline}))}",
    'severity': 'critical' if any(e['severity'] == 'critical' for e in timeline) else 'medium',
    'opened': datetime.datetime.utcnow().isoformat() + 'Z',
    'source': 'splunk/BabySOARus',
    'splunk_sid': context.get('sid', ''),
    'findings': [
        {'user': e['user'], 'src_ip': e.get('src_ip'),
         'severity': e['severity'], 'reasons': e['reasons'],
         'actions': e['actions_taken']}
        for e in timeline
    ],
})
case = json.loads(r['body']) if r['status'] < 300 else {'id': 'unfiled', 'url': ''}

# --- 5. notify -----------------------------------------------------------
critical = [e for e in timeline if e['severity'] == 'critical']
if critical:
    http_request('POST', secret('pager_webhook'), body={
        'severity': 'critical',
        'summary': f"{len(critical)} account(s) contained: "
                   f"{', '.join(e['user'] for e in critical)}",
        'links': [{'href': case.get('url', ''), 'text': 'case'}],
    }, timeout=10)

for e in timeline:
    e['case_id'] = case.get('id', '')
    e['case_url'] = case.get('url', '')

events = timeline
Long, but every line is doing something an analyst would otherwise do by hand, and the whole plan is visible at once.
Design Notes
Never contain without an exclusion list. NEVER_DISABLE exists because
the first time an automated plan disables a service account, automation gets
switched off permanently. Make the list explicit and put it near the top.
Record what you tried, not what you intended. Every action appends its
real outcome to actions_taken, including failures. When someone asks what
happened at 3am, the answer is in the case.
Degrade rather than fail. An enrichment API being down should not stop containment. Check status codes, carry on with what you have.
Keep secrets out of the snippet. The secret() helper reads from Splunk's
password store using the search's own credentials, so the code is safe to
commit.
Staged Rollout
Automated containment is a trust exercise. Stage it.
Stage 1: observe. Run the plan with all actions replaced by logging. Compare its decisions against what analysts actually did.
DRY_RUN = True

def act(description, request):
    if DRY_RUN:
        return f'[dry run] would {description}'
    r = request()
    return description if r['status'] < 300 else f'{description} FAILED ({r["status"]})'
Stage 2: reversible actions only. Revoke sessions and require a password reset. Both are annoying and neither is destructive.
Stage 3: containment, with a whitelist. Isolate hosts, but only ones on a list you maintain deliberately.
Stage 4: containment by policy. Isolate anything meeting the criteria, with the exclusion list as the guard.
Most teams stop at stage 2 or 3, and that is a perfectly good place to stop.
Approval Gates
Some steps should need a human. prompt.ask asks and returns immediately --
the plan does not block waiting for an answer, and finishes as if it had not
asked at all:
from babysoarus_exec import prompt

def process(events):
    # A resumed run carries the decision in the first event, not a fresh batch.
    if events and 'prompt_response' in events[0]:
        e = events[0]
        approved = e['prompt_response'] == 'yes'
        e['contained'] = approved
        if approved:
            http_request('POST', f'{PROXY}/api/isolate', body={'host': e['host']})
        return [e]

    for e in events:
        if e['severity'] == 'critical' and not e['contain']:
            prompt.ask(f"isolate {e['host']}?", ['yes', 'no'],
                       ['soc-lead'], timeout=1800)
            e['status'] = 'awaiting approval'
    return events
Answering happens later, outside this run, from the Activity view any
Splunk user with BabySOARus access already has -- not a second callback endpoint
of your own. Once someone in approvers answers, this same function runs
again automatically, as a background task, with a fresh batch of one event
carrying prompt_response/prompt_responder. timeout (seconds; 0 means
none) refuses a late answer rather than accepting it.
This is a real approval gate, not a pattern you assemble from http_request
and a second saved search. approvers is a list of usernames (not yet roles
or capabilities), checked server side against who is actually answering, never
trusted from the browser. The full chain -- who was asked, who answered, when,
and what ran as a result -- is recorded and visible in Activity's own
Pending/History tabs, not something to build a dashboard for separately.
Testing
Test the plan the way you test a detection: give it known input and check what it decides.
| makeresults
| eval user="d.harrington", src_ip="185.199.110.9", preceding_failures="34"
| exec inline="DRY_RUN = True
..."
| table user severity contain actions_taken
With DRY_RUN = True the plan runs end to end, calls nothing, and prints what
it would have done. Run that on a schedule against synthetic input and you
have a regression test for your response process.
Replacing SOAR Workflows
- Where It Actually Runs
- An Honest Comparison
- The Same Playbook, Both Ways
- Performance, without a Number to Misuse
- Security and the Supply Chain
- What You Lose
- What You Gain
- A Sensible Migration
- What Is Coming, and What Is Not Yet
- When to Keep SOAR
- Practical Patterns
Most SOAR deployments run a handful of playbooks that are, underneath, a sequence of API calls with some branching. The platform around them exists to schedule those calls, store credentials, and show a diagram. That platform is also a second thing: a second install, a second database, a second copy of your data, a second bill on top of what you already pay Splunk for.
If your data is already in Splunk and your triggers are already Splunk alerts, much of that platform is doing work you are also paying Splunk to do -- on infrastructure you did not need to stand up in the first place.
Where It Actually Runs
This is the difference that the rest of this page follows from, so it is worth stating plainly before anything else. SOAR is a separate platform. It has its own install, its own database, its own upgrade cycle, and its own estate to size, patch and back up, sitting next to Splunk rather than inside it. Every playbook run means your event left Splunk, arrived at that second platform, and got acted on there.
BabySOARus has none of that, because it is not a second platform. It ships as
a Splunk app and runs its daemon on the hosts already running splunkd --
the search head, and (exec reports itself as distributable) the indexers
too, if that is where you want the work done. There is no event export, no
second copy of your data, and no new estate to operate: whatever already
scales, patches and backs up Splunk already does the same for this. A
detection and its response can be the same search.
An Honest Comparison
| Aspect | SOAR platform | BabySOARus |
|---|---|---|
| Where it runs | Its own platform, installed and operated separately | The search heads (and indexers) you already run |
| Data movement | Copied into the platform | Never leaves Splunk |
| Trigger | Ingest events, correlate, fire | The Splunk alert you already have |
| Playbook format | Visual graph, exported as JSON | Python in version control |
| Testing a playbook | Platform's test harness | Run the search, or babysoarus-ci with no Splunk at all |
| Adding an integration | Install or write an app | http_request(...) |
| Integration trust model | A vendor's app, with whatever access the platform's asset model grants it | Your own reviewed Python, sandboxed regardless of what it tries to do |
| Time to first version | Days | Minutes |
| Approval gates | Built in | Built in (prompt.ask, an approval inbox with a full audit trail) |
| Execution visibility | A run history and a live status view | Built in (Activity's Tasks panel for the audit trail, Running now for what is executing this moment) |
| Case management | Built in | Whatever you already use |
| Multi-tenancy, RBAC | Built in | Splunk's |
| Visual diagram for auditors | Yes | Not yet -- see what's coming |
| Licence cost | Significant, per analyst seat | A flat per-deployment fee, not metered by use |
Two rows in that table are still where SOAR genuinely wins outright: built-in case management and a diagram an auditor will accept today. If those matter to you on their own, keep the platform for them specifically -- see when to keep SOAR below, which is narrower than it used to be.
What BabySOARus changes is the calculation for teams whose playbooks are "enrich, decide, call three APIs, open a ticket". That is most playbooks.
The Same Playbook, Both Ways
Playbook: phishing URL reported by a user.
In a SOAR platform: a graph of nine blocks, each configured through a form, connected by conditional edges, with an app installed for each integration.
Here:
for e in events:
    url = e['reported_url']

    # 1. Detonate.
    r = http_request('POST', f'{SANDBOX}/api/v2/submit',
                     headers={'Authorization': 'Bearer ' + sandbox_token},
                     body={'url': url, 'timeout': 60}, timeout=30)
    verdict = json.loads(r['body']) if r['status'] == 200 else {}
    e['sandbox_verdict'] = verdict.get('verdict', 'unknown')
    e['sandbox_score'] = verdict.get('score', 0)

    # 2. Who else got it?
    r = splunk_request('GET',
        '/services/search/jobs/export?output_mode=json&search='
        f'search index=email url="{url}" earliest=-7d | stats dc(recipient) as recipients')
    e['recipients'] = 0
    for line in r['body'].decode().splitlines():
        if line.strip():
            try:
                e['recipients'] = int(json.loads(line)['result']['recipients'])
            except (KeyError, ValueError):
                pass

    # 3. Decide.
    if e['sandbox_score'] > 70:
        e['decision'] = 'malicious'
    elif e['sandbox_score'] > 30 or e['recipients'] > 20:
        e['decision'] = 'review'
    else:
        e['decision'] = 'benign'

    # 4. Act.
    e['actions'] = []
    if e['decision'] == 'malicious':
        r = http_request('POST', f'{PROXY}/api/blocklist',
                         headers={'Authorization': 'Bearer ' + proxy_token},
                         body={'url': url, 'reason': 'phishing, sandbox confirmed'})
        e['actions'].append('blocked at proxy' if r['status'] < 300 else 'proxy block FAILED')

        r = http_request('POST', f'{EMAIL}/api/quarantine',
                         headers={'Authorization': 'Bearer ' + email_token},
                         body={'url': url, 'scope': 'all_mailboxes'})
        e['actions'].append('quarantined' if r['status'] < 300 else 'quarantine FAILED')

    # 5. Tell the reporter.
    http_request('POST', NOTIFY, body={
        'to': e['reporter'],
        'subject': f'Your phishing report: {e["decision"]}',
        'body': f"Thank you. Verdict: {e['decision']}. "
                f"Actions: {', '.join(e['actions']) or 'none required'}.",
    })
Forty lines, in Git, reviewable in a pull request, testable by running a search. The diagram is the code.
Performance, without a Number to Misuse
This page will not quote a benchmark figure for either platform, and that is deliberate: a number taken on one machine describes that machine, not yours, and a published figure invites exactly the wrong comparison. What can be said without a number is the architecture, and it does not need one to make the case.
A SOAR playbook action pays for leaving Splunk. The event is serialised, handed to a separate platform, picked up by that platform's own execution path, and (by design, since isolating one vendor's app from another is the point) very often started in an environment spun up for that action specifically. None of that is a flaw in SOAR -- it is what a general-purpose orchestration platform running arbitrary third-party apps has to do to stay safe. It is simply cost that exists because the work happens somewhere else.
BabySOARus never leaves. The daemon runs on the host already running your search, keeps a pool of interpreters already booted, and hands a batch of events to one directly -- there is no second platform to reach, no job queue to wait on, and for an enrichment step, no separate round trip to notice at all: the answer is already part of the search that asked for it. How the daemon keeps this warm is measured in microseconds rather than milliseconds for the overhead it adds beyond your own code, and published figures will appear there once they come from repeatable hardware rather than a laptop -- the same discipline this page holds itself to.
Security and the Supply Chain
A SOAR "app" is someone else's code, trusted with whatever the platform's asset model grants it. That is a reasonable trade for an app store's worth of pre-built integrations, but it is a real trust boundary: installing an integration means installing a vendor's Python, and its blast radius is whatever the platform lets an app reach.
BabySOARus's sandbox does not trust the code at all, including your own. Every function runs inside a WebAssembly component with no ambient access to anything -- no network, no filesystem beyond an explicit read-only mount, no process spawning -- until an explicit allow-list grants it. That holds regardless of whether the code came from your own git history or a built-in library entry: the sandbox does not know the difference, and does not need to trust either.
The same property that removes a second platform also removes a second thing to secure: there is no second database holding a copy of your events, no second set of credentials for it, and no second incident if that platform is the one that gets breached.
What You Lose
Be honest about this before proposing it.
No visual editor, yet. Someone who does not write code cannot modify a playbook today. For many teams that is a feature, but say so out loud -- and see what's coming for where this is headed.
No case management. You need somewhere to put cases. Most teams already
have one, and http_request reaches it.
No built-in credential vault. Splunk's password store works and is reachable over REST, but it is not a purpose-built secrets manager.
No audit diagram. Approval gates carry a full record of who was asked, who answered and what ran as a result, but that is a log, not a picture. If a regulator specifically wants a diagram, code is not one.
What You Gain
Playbooks in version control. Diffs, reviews, blame, branches, rollback. Ask anyone who has tried to review a change to a visual playbook.
Testing that is just running it. Set DRY_RUN = True and execute the
search. No separate test environment.
No data duplication. The playbook runs where the data already is. Nothing is copied into a second platform, which removes an entire class of "why does the SOAR show something different" problems.
Minutes, not days. New integration? It is an HTTP call. You do not need an app, a connector, or a vendor.
One skill. Detection engineers write Python for detections and Python for response. There is no second product to learn.
A Sensible Migration
Do not attempt a big-bang replacement.
Start with enrichment playbooks. They are read-only, so the blast radius is zero. Most SOAR deployments have several, and they are the easiest to move.
Then move notification playbooks. Also low risk, and immediately valuable because the notifications get better when they are code.
Then containment, in dry-run. Run alongside the platform and compare decisions for a few weeks.
Then switch the triggers. Turn off the platform's version once you have watched the replacement agree with it.
Keep the platform for what it is good at. Case management, a no-code editor for non-engineers, and a visual diagram a regulator wants to look at. Running three playbooks in a platform is a much smaller licence than running thirty.
What Is Coming, and What Is Not Yet
One row in the table above is marked "not yet" rather than "no" on purpose, and two more gaps beyond the table follow the same shape. All three are designed already, not merely hoped for, and all three are deliberately sequenced after the core -- licensing, the content library, the connector pattern -- rather than before it, so this section says plainly what exists today and what does not, instead of blurring the two.
A visual flow editor. Closes the "no-code" gap in the table above directly: a non-engineer building and adjusting a response flow without writing Python. Designed, not yet built.
A signed integrations catalogue. The one hand-built connector this product ships today (Microsoft Defender for Endpoint, both enrichment and response actions) already proves the pattern -- an HTTP call and a documented secret, not a from-scratch app -- works without a marketplace around it. The catalogue adds curation and per-integration access control on top of that same pattern, closing the breadth SOAR's own app store still wins on today. Designed, not yet built.
An agent-facing surface. AI agents already documents why this sandbox -- deny-by-default, no ambient access, a tool call that either succeeds within its grant or fails loudly -- is a genuinely good execution substrate for an LLM tool call, today, with what already exists. A dedicated UI for that workflow is on the same roadmap, and unlike the two gaps above, it is not chasing a capability SOAR already has: no SOAR platform offers an equivalent story for agentic investigation today.
None of the three above should be treated as available now. What already ships -- the sandbox, the editor, saved functions addressed by name, version history, testing without Splunk, the debugger, background tasks with a real task manager and audit trail, a live view of what is executing right now, notifications and a real approval gate with its own audit trail -- is real and is what the rest of this page describes.
When to Keep SOAR
Keep it if:
- your triggers are not Splunk alerts;
- non-engineers must edit playbooks today, not once the visual editor above ships;
- you need case management and do not have another system;
- you orchestrate across many products where the breadth of a mature app store is genuinely doing work you do not want to do yourself, today;
- a regulator specifically requires a visual diagram, not a recorded log of who approved what.
Consider replacing it if:
- your playbooks are mostly "enrich and notify";
- your triggers are already Splunk alerts;
- your team writes code comfortably;
- you already have case management;
- a recorded approval trail satisfies your compliance need, and a diagram specifically does not need to exist for it;
- the licence is hard to justify against what it actually runs.
Practical Patterns
Credentials. Read them from Splunk's password store at run time. See Alert actions.
Idempotency. Alerts can fire twice. Key actions on something stable and check before acting.
r = http_request('GET', f'{CASES}/api/v1/cases?external_id={e["sid"]}')
if json.loads(r['body'])['total'] > 0:
    e['skipped'] = 'case already exists for this search id'
    continue
Rate limits. Batch by design. events is already a batch, so build one
request from it rather than one per row.
Failure handling. Record what failed on the event itself and raise at the end, so a partial run is visible rather than silent.
Long-running actions. Do not block for minutes inside a snippet. Kick off the job, record its identifier, and let a second scheduled search collect the result.
AI Agents
- Why SPL Is Hard for Models
- The Sandbox Is the Point
- A Tool Definition
- Prompting Notes
- Where It Earns Its Keep
- An Agent Loop That Works
- Guardrails to Add
- A Note on Where This Is Going
Language models are unreliable at writing SPL and quite good at writing short Python. BabySOARus turns the second skill into the first.
Why SPL Is Hard for Models
SPL has an unusual evaluation model, a large surface of commands with overlapping purposes, and syntax that varies between Splunk versions. A model asked for "the standard deviation of gaps between events, per host" will produce something plausible that is subtly wrong, and the error will not surface until the numbers are quietly incorrect.
Python is the most represented language in training data, and its semantics
are unambiguous. A model asked for the same thing in Python produces
statistics.pstdev(gaps) and gets it right.
So split the problem:
model writes:   a narrow SPL search (index, sourcetype, time, stats)
model writes:   the analysis, in Python
BabySOARus runs:    the Python, sandboxed, over the results
The SPL stays simple enough to be reliable. The judgement goes in Python, where the model is strongest.
The Sandbox Is the Point
Letting a model generate code and running it is only sensible if the runtime constrains it. BabySOARus does:
| Risk | Constraint |
|---|---|
| Runaway loop | Execution deadline, guest interrupted |
| Data exfiltration | No sockets; HTTP only via a host function you can log |
| Filesystem access | Only mounted lookup directories |
| Credential theft | No environment variables; only this search's own token |
| Host compromise | WebAssembly isolation, not a subprocess |
| Resource exhaustion | Memory ceiling per instance, pooled and bounded |
A model producing import os; os.system("...") gets ModuleNotFoundError for
anything that would matter, and there is no subprocess to reach.
That does not make it safe to run arbitrary generated code against production data without thought. It does make the failure modes bounded and boring, which is the difference between an interesting experiment and something you can put in front of an analyst.
A Tool Definition
If you are wiring an agent to Splunk, this is the shape that works:
{
  "name": "splunk_analyse",
  "description": "Run a Splunk search and analyse the results with Python. Keep the SPL simple: index, filters, time range and a stats aggregation. Put all judgement, scoring and classification in the Python, which receives the results as `events`, a list of dicts of strings.",
  "input_schema": {
    "type": "object",
    "properties": {
      "spl": {
        "type": "string",
        "description": "The search up to and including any stats. Do not include the exec command."
      },
      "python": {
        "type": "string",
        "description": "Python operating on `events`. Mutate events to add fields; rebind `events` to filter or expand. Field values are strings, so convert before arithmetic."
      },
      "earliest": {"type": "string", "default": "-24h"},
      "latest": {"type": "string", "default": "now"}
    },
    "required": ["spl", "python"]
  }
}
The tool composes them:
search = f'{spl}\n| exec inline="{python_escaped}"'
Two properties make this reliable. The model never writes the exec plumbing,
so it cannot get the quoting wrong. And the Python is a self-contained
function of events, which is the kind of problem models are best at.
Prompting Notes
Things worth putting in the system prompt, all learned the hard way:
"Every field value is a string." Without this, models write
e['bytes'] > 1000 and get string comparison.
"events is a batch, not the whole result set." Otherwise they write
len(events) expecting a total. Tell them to aggregate in SPL.
"Only the standard library is available, and only these modules." List
them. It stops the model reaching for pandas.
"Use http_request, not requests." With the signature. Models will
otherwise write import requests every time.
"Attach reasons, not just scores." Produces far more useful output, and costs the model nothing.
Where It Earns Its Keep
Ad-hoc analyst questions. "Which hosts talked to something that looks algorithmically generated this week?" becomes a search plus fifteen lines, generated and run in one turn. The analyst reads the Python and can tell whether it answered the question, which they cannot easily do with generated SPL.
Detection drafting. A model turns a threat report into a candidate detection. Because the output is Python, a human reviews it like any other code, then saves it as a scheduled search.
Triage assistance. An agent enriches a notable, weighs the context and proposes a disposition with its reasoning attached. The reasoning is in the code path, so it can be checked rather than trusted.
Hunt generation. Give a model a hypothesis and let it write the analysis. The cost of a bad hunt is one search that returns nothing.
An Agent Loop That Works
1. Agent proposes { spl, python }
2. Tool runs it with `| head 100` appended, over a short time range
3. Agent sees the first few rows and any error
4. Agent revises
5. When it looks right, run it for real
Step 2 matters. Constraining the first attempt to a hundred events over an
hour means a wrong answer costs nothing and the model gets a fast, honest
error message. Errors from BabySOARus are already model-friendly: KeyError: 'bytes_out' tells it exactly what to fix.
Guardrails to Add
The sandbox handles the runtime. Add policy on top:
Restrict which indexes the tool may search. Enforce it in your tool, not in the prompt.
Cap the time range. Models reach for earliest=-90d without thinking
about it.
Log the generated code. Both halves, with the search id. It is your audit trail, and it is the training data for improving the prompt.
Require approval for side effects. Read-only analysis can be automatic. Anything calling an API that changes state should have a human between the model and the action.
Use a dedicated Splunk user. With its own role and index restrictions, so the credentials handed to the sandbox cannot reach more than the tool should.
A Note on Where This Is Going
The interesting property is not that a model can write Python. It is that the same artefact works for a human and a model. An analyst writes a snippet interactively; an agent generates one; both run in the same sandbox with the same limits and the same error messages. A hunt an agent drafts can be saved as a detection by a human without translation.
That shared surface is worth more than any individual capability, because it means the boundary between what people do and what agents do can move gradually, in either direction, without rebuilding anything.
Commands and the Alert Action
The three ways guest code is invoked. exec and execgen are search
commands, typed into a search bar; execalert is an alert action, configured
on a saved search. All three run the same guest code against the same daemon,
so what you learn about one applies to the others.
Exec
Streaming command. Runs guest code over every event flowing through the pipeline.
... | exec (inline=<python> | function=<name>) [batch_size=<n>] [autocast=<mode>] [<key>=<value> ...]
| Argument | Default | Description |
|---|---|---|
inline | Python source to run for each micro-batch. | |
function | Name of a .wasm component in functions/. The .wasm suffix is optional. | |
batch_size | 32 | Events handed to the guest per call. |
autocast | false | Infer types for field values: true, false or strict. See Inline Python. |
<key>=<value> | Anything else is passed to guest code as params. See Parameters from the search. |
inline and function are mutually exclusive. Exactly one is required.
Reports itself to Splunk as type = streaming, so it may be distributed to
indexers. Add local = true to the commands.conf stanza to pin it to the
search head.
index=web | exec inline="for e in events: e['host'] = e['host'].lower()"
index=web | exec function=enrich batch_size=256
Execgen
Generating command. Produces events rather than transforming them, so it must be first in the pipeline.
| execgen (inline=<python> | function=<name>)
Same arguments as exec. The guest is called once with an empty events
list; whatever it leaves in events becomes the search results.
Reports itself as type = stateful, which means it runs on the search head
and is not distributed.
| execgen inline="events = [{'i': i, 'square': i * i} for i in range(100)]"
Execalert
Alert action. Runs guest code over a scheduled search's results after it fires.
Configured on a saved search rather than typed into a search bar:
action.execalert = 1
action.execalert.param.inline = for e in events: e['seen'] = 1
| Parameter | Description |
|---|---|
param.inline | Python source to run for each micro-batch of result rows. |
param.function | Name of a .wasm component. |
param.autocast | Type inference: true, false or strict. Defaults to off. |
Mutually exclusive, one required. Splunk writes unset parameters as empty strings, which are treated as absent.
An alert with no results still calls the guest once with an empty events
list, so side-effect-only actions run.
See Alert actions.
Field Semantics
Everything is a string. Splunk's data model is text. Convert before doing
arithmetic, or set autocast=true to have types inferred for you.
Multivalue fields are lists. A field Splunk holds as multivalue arrives as a list of strings, and a list you assign becomes a multivalue field.
Missing fields are absent. Not None, not empty string. Use .get().
Search-time extracted fields must be referenced first. Splunk only
materialises extracted fields that something in the pipeline mentions, and
guest code is opaque to it. Reading raw events directly needs an explicit
| fields ... before the command:
index=auth | fields _time user src_ip action | exec inline="..."
This does not apply after stats, table or eval, which have already
materialised what they produce.
Field order is preserved from input to output, and fields your code adds are appended in the order it adds them.
Values are converted on the way out as follows:
| Python type | Splunk field |
|---|---|
str | As-is |
int, float | Decimal string |
bool | 1 or 0 |
None | Empty |
list of 1 | Scalar |
list of many | Multivalue |
dict | Compact JSON |
bytes | Base64 |
datetime, date | ISO 8601 |
set, tuple | Multivalue |
| Anything else | str(value) |
Errors
Errors reach the search as FATAL: Error in 'exec' command: <message>.
Splunk's CLI hides these under -output json. Use the default output to see
them:
splunk search '| makeresults | exec inline="1/0"' -auth ...
FATAL: Error in 'exec' command: ZeroDivisionError: division by zero
A syntax error is reported before any events are processed. A runtime error fails the batch it occurred in; earlier batches have already been emitted.
Exit Behaviour
The command exits non-zero and reports through the protocol when it cannot start: unknown function, unparseable arguments, or a daemon it cannot reach or start. Splunk shows the message on the search rather than "external search command exited unexpectedly".
Guest Contract
- The World
- Exports
- Imports
- Lifecycle
- Error Handling
- No WASI CLI Imports
- Preview 1 Is Not Supported
- Reference Implementation
Every component the daemon loads, the bundled Python interpreter and every custom function alike, implements one WIT world.
The World
package babysoarus:exec@0.1.0;

interface host {
    record http-response {
        status: u16,
        headers: list<tuple<string, string>>,
        body: list<u8>,
    }

    splunk-request: func(
        method: string,
        path: string,
        headers: list<tuple<string, string>>,
        body: list<u8>,
        timeout-ms: u32,
    ) -> result<http-response, string>;

    get-lookups-dirs: func() -> list<string>;

    get-run-context: func() -> string;
}

world exec {
    import host;

    import wasi:http/types@0.2.12;
    import wasi:http/outgoing-handler@0.2.12;

    export begin-run: func(code: option<string>) -> result<_, string>;
    export execute-batch: func(batch-json: string) -> result<string, string>;
    export end-run: func() -> result<_, string>;
}
Exports
Begin-run(code) -> result<_, string>
Called once per search or alert-action invocation, even when the underlying instance has served many previous runs.
code is the inline source, if any. The Python interpreter compiles it here,
once, and caches the code object. A fixed custom function ignores it.
Returning the error arm is a normal, reportable condition, such as a syntax error in a user's snippet. The message reaches the search.
Reset per-run state here. Anything the previous run left behind must not be visible.
Execute-batch(batch-json) -> result<string, string>
Called once per micro-batch. The argument is a JSON array of objects; the return value is a JSON array of objects.
Returning fewer objects filters. Returning more expands. Returning an empty array drops the batch.
Reordering is safe too, but only ever sorts within the current micro-batch,
since that is all one call sees. To sort a whole result set, use a trailing SPL
| sort after the command, as every detection in the shipped library does.
End-run() -> result<_, string>
Called once when the run finishes, before the instance returns to the pool. Clear run-scoped state here.
If this traps or reports an error, the host drops the instance rather than pooling it.
Imports
Wasi:http/outgoing-handler
General outbound HTTP. Guest code has no sockets, so this is the only way to reach anything that is not Splunk itself.
It is a standard WASI interface rather than an babysoarus-specific import, which means two things. Any component-model toolchain can produce a client for it without knowing anything about BabySOARus. And every request passes through the daemon's network policy, so what a function may reach is configuration rather than code.
Splunk-request(...) -> result<http-response, string>
Calls splunkd's management API using this run's credentials.
path names an endpoint, not a URL: it is resolved against the base_url
splunkd handed the run, and a value that parses as an absolute URL is
rejected. The host attaches the credentials after resolving, so guest code
never holds a Splunk session token and cannot send one anywhere else.
This is separate from wasi:http because Splunk's management port normally
presents a self-signed certificate. The host owns that one narrow exception;
the general path keeps full verification.
timeout-ms of 0 means the default of 30 seconds. The host caps it at 300
seconds and caps the response body at 64 MB.
Get-lookups-dirs() -> list<string>
Returns the guest paths where Splunk lookup directories are mounted, typically
/lookups/system and /lookups/apps/<app>. The directories themselves are
reachable as ordinary WASI preopened directories.
Get-run-context() -> string
Returns the current run's context as a JSON object:
{
  "auth_headers": [["Authorization", "Splunk <token>"]],
  "base_url": "https://127.0.0.1:8089",
  "app": "search",
  "sid": "1754000000.42",
  "owner": "admin",
  "platform": "linux",
  "generating": false
}
Provided as an import rather than as a begin-run parameter so that custom
functions can reach the context without every one of them having to accept and
parse it.
auth_headers is on its way out. splunk-request no longer needs it, and it
will be removed once the host injects secrets for every destination rather
than just for Splunk. Do not build anything new on it.
Lifecycle
instantiate                    once per pooled instance
  |
  +-- begin-run(code)          once per search
  |     |
  |     +-- execute-batch(...)  once per micro-batch
  |     +-- execute-batch(...)
  |     +-- ...
  |     |
  |     +-- end-run()          once per search
  |
  +-- (returned to the pool, reused by an unrelated search)
State that survives instantiation is where the performance is: caches, compiled patterns, parsed tables. Build them lazily on first use and every later search benefits.
State that must not survive a run belongs behind begin-run and end-run.
Error Handling
| Outcome | Meaning | Instance |
|---|---|---|
Ok | Success | Returned to the pool |
Err(message) | Guest-reported error, such as bad user code | begin-run: dropped. execute-batch: kept |
| Trap or panic | Unexpected failure | Dropped |
| Deadline exceeded | Ran too long | Dropped |
A trap is treated as poisoning because guest globals could be in any state. A
reported error during execute-batch is not, because the guest chose to
report it and its invariants presumably hold.
No WASI CLI Imports
The world deliberately does not import wasi:cli/{stdin,stdout,stderr}.
The contract is JSON in, JSON out, with explicit error channels, so guest stdio is not load-bearing.
That is a statement about the contract, not about the component. The bundled
Python interpreter's own build imports the whole of wasi:cli for CPython's
benefit, and the daemon's linker provides full WASI Preview 2, so filesystem
access to lookup directories works normally.
Preview 1 Is Not Supported
Only genuine WASI Preview 2 components load. Core modules built for
wasm32-wasip1, including anything exporting a raw process(ptr) -> ptr C
ABI, are rejected.
Supporting Preview 1 would mean carrying an adapter module in every instance, which costs memory in the pool and adds a compatibility surface. Every loaded component here is backed by a single core instance.
Reference Implementation
The app ships a compiled reference component, installed as
functions/public/example.wasm and callable as exec function=example. Its
complete Rust source, with the decisions explained, is walked through in
Custom WebAssembly Functions.
It is also the fixture BabySOARus's own test suite runs against, so it is
guaranteed to stay correct.
Daemon Protocol
How the per-search client binaries talk to the daemon. You do not need this to use BabySOARus; it is here because the protocol is small enough to describe completely, and knowing it makes the logs legible.
Transport
A Unix domain socket at <app>/var/daemon.sock, mode 0600.
One connection per search or alert-action invocation, opened at the start and closed at the end. The connection is full-duplex: the client keeps sending events while results come back.
Framing
[4-byte little-endian payload length][1-byte frame type][payload]
The length counts only the payload. Read four bytes, read one byte, read that many bytes.
| Type | Byte | Direction | Payload |
|---|---|---|---|
Hello | 0 | client → daemon | JSON: which function, credentials, run metadata |
HelloAck | 1 | daemon → client | JSON: Ok, or an error to show the user |
Event | 2 | client → daemon | JSON array of event objects |
Result | 3 | daemon → client | JSON array of event objects |
Error | 4 | daemon → client | UTF-8 message, non-fatal |
End | 5 | client → daemon | Empty: no more events |
Done | 6 | daemon → client | Empty: all results flushed |
Frames within a connection are strictly ordered, so results match requests by arrival order. There are no correlation identifiers, because there is nothing to correlate.
Payloads are capped at 64 MB, which bounds memory if a peer sends a corrupt length prefix.
Exchange
client                          daemon
  |                               |
  |------------ Hello ----------->|  resolve function, take a warm instance,
  |                               |  call begin-run
  |<--------- HelloAck -----------|
  |                               |
  |------------ Event ----------->|  execute-batch
  |------------ Event ----------->|  (pipelined: the client does not wait)
  |<--------- Result -------------|
  |------------ Event ----------->|
  |<--------- Result -------------|
  |<--------- Result -------------|
  |                               |
  |------------- End ------------>|  end-run, return the instance to the pool
  |<---------- Done --------------|
The client keeps up to eight Event frames outstanding before waiting for
results. That keeps the daemon busy while the client encodes the previous
answer, and bounds memory at a few hundred events rather than the whole search.
A guest-reported error arrives as an Error frame in place of the Result
for that batch. The connection stays open and later events are still
processed, which is why one bad batch does not abort a search.
Lazy Start
The client tries to connect. If the socket is missing or refused, it starts
the daemon as a detached process with setsid, redirecting stdio to
var/daemon.log, then retries with a short backoff.
Two searches starting at the same instant may both try. The daemon takes an
exclusive flock on var/daemon.lock before binding its socket, so the loser
exits quietly and its client connects to the winner's socket.
The daemon is deliberately not a child of the search process. Splunk tears down a search's process group when the search ends, and the whole point is to outlive it.
Splunk-facing Protocols
The client binaries speak two Splunk protocols on the other side. Both are Splunk's, and both were implemented against the Splunk SDK for Python's own source rather than from prose documentation.
Chunked Custom Search Command Protocol v2
Used by exec and execgen on stdin and stdout.
chunked 1.0,<metadata_length>,<body_length>\n
<metadata_length bytes of UTF-8 JSON>
<body_length bytes of CSV>
- Splunk sends a chunk with
action: "getinfo"and an empty body. Itssearchinfocarries the arguments, session key, management URI and search identifiers. - The command replies with a metadata-only chunk containing its configuration:
typeandgenerating. - Splunk sends
action: "execute"chunks, each with afinishedflag and a CSV body. The command replies to each with its own chunk, mirroringfinished.
Bodies use Splunk's CSV dialect: comma delimited, " quoting with doubling,
CRLF terminators, and a __mv_<field> companion column beside every field
carrying the multivalue encoding $a$;$b$, with a literal $ escaped as $$.
Alert Action Contract
Used by execalert. Splunk runs the binary with --execute and a JSON
payload on stdin, containing among other things a path to the results file.
That file is Splunk's CSV, usually gzipped. Compression is detected by magic
bytes rather than filename, because the extension is not guaranteed.
Why Not gRPC
The protocol carries JSON arrays over a local socket between two processes built from the same repository at the same version. Length-prefixed frames are about fifty lines of code on each side, add no dependencies, and have no schema-compatibility story to maintain because there is nothing to be compatible with.
Implementation
| File | Contains |
|---|---|
crates/babysoarus-proto/src/lib.rs | Frame encoding and decoding |
crates/babysoarus-proto/src/splunk/chunked.rs | Chunked protocol v2 |
crates/babysoarus-proto/src/splunk/csv.rs | Splunk's CSV dialect |
crates/babysoarus-daemon/src/server.rs | The daemon side of the connection |
All four have test suites; the CSV and chunked modules in particular are covered against the exact encodings the Splunk SDK produces.
Performance
What BabySOARus does to keep per-search overhead small, and how to measure it on your own hardware.
Published figures are deliberately absent. Numbers taken on one developer machine describe that machine, not your search head, and quoting them invites capacity planning built on the wrong hardware. Measured figures will appear here once they are produced by continuous integration on a known, fixed specification, together with that specification.
Where the Time Goes
A search using exec pays three costs: starting the daemon, starting a
sandbox instance, and running your code over each micro-batch. Only the third
scales with your data.
Daemon startup happens once per host, on the first search that needs it, and is a memory map of a precompiled artefact rather than a compilation. A daemon that is already running contributes nothing.
Instance startup happens when no warm instance is free. The daemon keeps a pool of booted interpreters and returns each one after use, so in steady state a search takes an instance that has already imported the standard library. A cold instance costs roughly two orders of magnitude more than a warm one, which is why the pool exists.
Per-batch execution is your code. Everything BabySOARus adds around it, taking a warm instance, handing it a batch and taking the results back, is measured in microseconds rather than milliseconds, so for most searches the interesting cost is the logic you wrote.
What Makes It Fast
Each of these is measurable on its own, and they compound.
| Technique | Effect |
|---|---|
| Persistent daemon | Removes process, engine and interpreter startup from every search |
| Precompiled artefact | Turns "compile CPython" into "map a file" |
| Pooling allocator | Reuses memory and table slots instead of fresh mappings |
| Copy-on-write memory | Instantiates from the image rather than re-running initialisers |
| Resolved imports | Component imports are resolved once, not once per instantiation |
| Warm instance pool | Reuses booted interpreters instead of starting one per search |
| Compile-once snippets | Parses your source once per search, not once per batch |
| Content-hash artefact cache | Never compiles the same bytes twice, including across restarts |
| Yielding deadline callback | Keeps concurrent searches genuinely parallel |
The last one is not an optimisation so much as a requirement. A guest running a tight loop occupies the thread it runs on, so the daemon interrupts it periodically and yields. Without that, a handful of CPU-heavy searches would serialise behind each other, and a single infinite loop could starve the timer meant to interrupt it.
Choosing a Batch Size
batch_size trades latency against throughput. Smaller batches return the
first results sooner; larger batches amortise per-call work over more events.
The default of 32 sits where the throughput curve begins to flatten: going from 1 to 32 is a large improvement, and going well beyond it is a much smaller one paid for with slower first results. Raise it when your snippet does expensive per-batch setup, and lower it when someone is waiting.
batch_size=1 is a legitimate choice rather than a pathological one.
Measuring It Yourself
Run these on hardware you care about, on an idle machine, and read the spread rather than a single number.
make guests precompile      # build the artefacts the benchmarks need
make bench                  # daemon-level measurements
For end-to-end latency through a real Splunk instance:
bash scripts/install-splunk.sh
bash scripts/setup-splunk.sh
SPLUNK_HOME=~/splunk make install
bash scripts/seed-demo-data.sh
bash scripts/bench-splunk.sh
Reading the Output
make bench reports every figure as a median with its 10th and 90th
percentiles, never a mean, because the distributions are skewed by scheduler
noise and a mean hides that.
Each run begins with a null control: the same code measured as both the A and the B side of a comparison, interleaved so that any advantage from being measured first cancels out. Nothing differs between the two sides, so whatever difference it reports is measurement error. Treat any difference smaller than that as meaningless.
The run also prints the machine's load per CPU with a verdict. A figure taken on a busy machine is not worth recording, and the harness says so rather than leaving you to judge.
End-to-end latency through Splunk is dominated by Splunk's own search
dispatch, which is unrelated to BabySOARus and varies by hundreds of milliseconds
between runs. Compare against the same search without exec rather than
reading the absolute number, and expect small differences to be invisible.
Troubleshooting
- "Unknown Search Command 'Exec'"
- "Babysoarus-daemon Binary Not Found"
- "Could Not Connect to Babysoarus-daemon Within 30s"
- "The Bundled Python Executor Is Not Loaded"
- "Unknown Function 'X'; Available Functions: ..."
- "ModuleNotFoundError" in Inline Python
- "Guest Exceeded Its Execution Time Budget"
- Results Are Wrong in a Numeric Way
- "KeyError" on a Field That Is Definitely There
- A Search Hangs
- Everything Is Slower Than the Benchmarks
- Splunk Shows "External Search Command Exited Unexpectedly"
- Alert Action Does Not Run
- Starting Completely Fresh
"Unknown Search Command 'Exec'"
Splunk has not loaded the app.
ls "$SPLUNK_HOME/etc/apps/babysoarus/default/commands.conf"
$SPLUNK_HOME/bin/splunk restart
If the file is there and a restart did not help, check that the app is
enabled and that metadata/default.meta exports the commands to system scope.
"Babysoarus-daemon Binary Not Found"
The app is installed but bin/babysoarus-daemon is missing or not executable.
ls -l "$SPLUNK_HOME/etc/apps/babysoarus/bin/"
chmod +x "$SPLUNK_HOME/etc/apps/babysoarus/bin/"*
make install sets the modes; copying by hand sometimes does not.
"Could Not Connect to Babysoarus-daemon Within 30s"
The client started the daemon and it never bound its socket. The reason is in the log:
tail -50 "$SPLUNK_HOME/etc/apps/babysoarus/var/daemon.log"
Common causes:
No write permission on var/. The daemon runs as the Splunk user and
needs to create its socket, lock file and caches there.
A stale socket owned by another user. Delete var/daemon.sock and retry.
The binary cannot execute. Wrong architecture, or a missing shared
library. ldd bin/babysoarus-daemon will say.
"The Bundled Python Executor Is Not Loaded"
Inline Python was requested but the interpreter is missing or unusable.
ls -l "$SPLUNK_HOME/etc/apps/babysoarus/wasm/"
Both exec.wasm and exec.cwasm should be present. If they are not, the
build skipped them:
make python precompile
SPLUNK_HOME=/opt/splunk make install
If the log says "precompiled Python executor is incompatible; falling back to
compiling exec.wasm", the .cwasm was produced by a different Wasmtime
version. Everything still works, but every daemon start pays a few seconds of
compilation. Rebuild it with make precompile.
"Unknown Function 'X'; Available Functions: ..."
The name does not match a .wasm file in functions/public/ or
functions/private/. The error lists what is loaded, which is usually enough.
If the file is there and not listed, it failed to load. The log says why:
grep 'failed to load function' "$SPLUNK_HOME/etc/apps/babysoarus/var/daemon.log"
The usual cause is a core module rather than a component. See Custom functions.
"ModuleNotFoundError" in Inline Python
The module was not imported when the interpreter component was built, so it does not exist inside the sandbox. This is a property of how the component is produced, not a path problem.
Add it to python/exec_component/requirements.txt if it is a third-party
package, or to the import block in babysoarus_exec.py if it is standard library,
then rebuild. See Dependencies.
"Guest Exceeded Its Execution Time Budget"
A batch ran longer than 30 seconds. Usually one of:
An accidental infinite loop. The deadline caught it, which is the point.
A slow HTTP call inside the per-event loop. Move it outside the loop and make one request for the batch.
Genuinely heavy work. Raise BABYSOARUS_TIMEOUT_EXECUTE_SECS, remembering it
applies per batch of 32 events, or lower batch_size so each call does less.
Results Are Wrong in a Numeric Way
Almost always string arithmetic:
e['total'] = e['bytes_in'] + e['bytes_out']       # '100' + '200' = '100200'
e['total'] = int(e['bytes_in']) + int(e['bytes_out'])   # 300
Every field value is a string. See Inline Python.
"KeyError" on a Field That Is Definitely There
Most often, Splunk never sent it.
Splunk only materialises search-time extracted fields that something in the pipeline references. Your snippet is opaque to Splunk, so a field you read but never mention elsewhere arrives missing.
# Does not work: nothing references `action`.
index=auth | exec inline="for e in events: e['x'] = e['action']"

# Works.
index=auth | fields _time user src_ip action | exec inline="..."
After stats, table or eval, the fields are already materialised and this
does not apply.
Failing that, the field is genuinely absent from some events, because Splunk fields are sparse:
user = e.get('user', 'unknown')
It can also be a naming mismatch: stats ... as x renames the field, and the
snippet must use the new name.
A Search Hangs
Check the daemon is alive and doing something:
pgrep -af etc/apps/babysoarus/bin/babysoarus-daemon
tail -f "$SPLUNK_HOME/etc/apps/babysoarus/var/daemon.log"
With BABYSOARUS_LOG=debug the log shows every instantiation and pool hit, which
tells you whether work is happening or the guest is stuck. A stuck guest is
interrupted by the execution deadline, so a hang lasting more than a minute is
more likely to be a slow HTTP call.
Everything Is Slower Than the Benchmarks
Check the daemon is using the pooling allocator:
grep 'engine ready' "$SPLUNK_HOME/etc/apps/babysoarus/var/daemon.log"
allocation=Pooling is what you want. allocation=OnDemand means it could
not reserve address space, usually a container memory limit or a low
vm.max_map_count, and instantiation will be slower.
Then check instances are being reused:
BABYSOARUS_LOG=debug   # then restart the daemon
grep -c 'instantiated cold instance' var/daemon.log
grep -c 'reusing warm instance' var/daemon.log
Mostly cold means the pool is too small for your concurrency. Raise
BABYSOARUS_POOL_SIZE.
Splunk Shows "External Search Command Exited Unexpectedly"
The command crashed rather than reporting through the protocol. That is a bug; please report it. To gather detail:
grep BabySOARus "$SPLUNK_HOME/var/log/splunk/splunkd.log" | tail -50
The search's own search.log in the dispatch directory has the command's
stderr.
Alert Action Does Not Run
Check it is enabled on the saved search:
grep -A5 'action.execalert' "$SPLUNK_HOME/etc/apps/*/local/savedsearches.conf"
Then check what it did:
grep babysoarus-alert "$SPLUNK_HOME/var/log/splunk/splunkd.log" | tail -20
The action logs the search name, the search id and the row count on every run. No line at all means Splunk never invoked it, which is a saved-search configuration problem rather than a BabySOARus one.
Starting Completely Fresh
pkill -f etc/apps/babysoarus/bin/babysoarus-daemon
rm -rf "$SPLUNK_HOME/etc/apps/babysoarus/var"
Everything under var/ is regenerable. The next search rebuilds it.